NASA Science
Fire’s Footprint on Santa Rosa Island
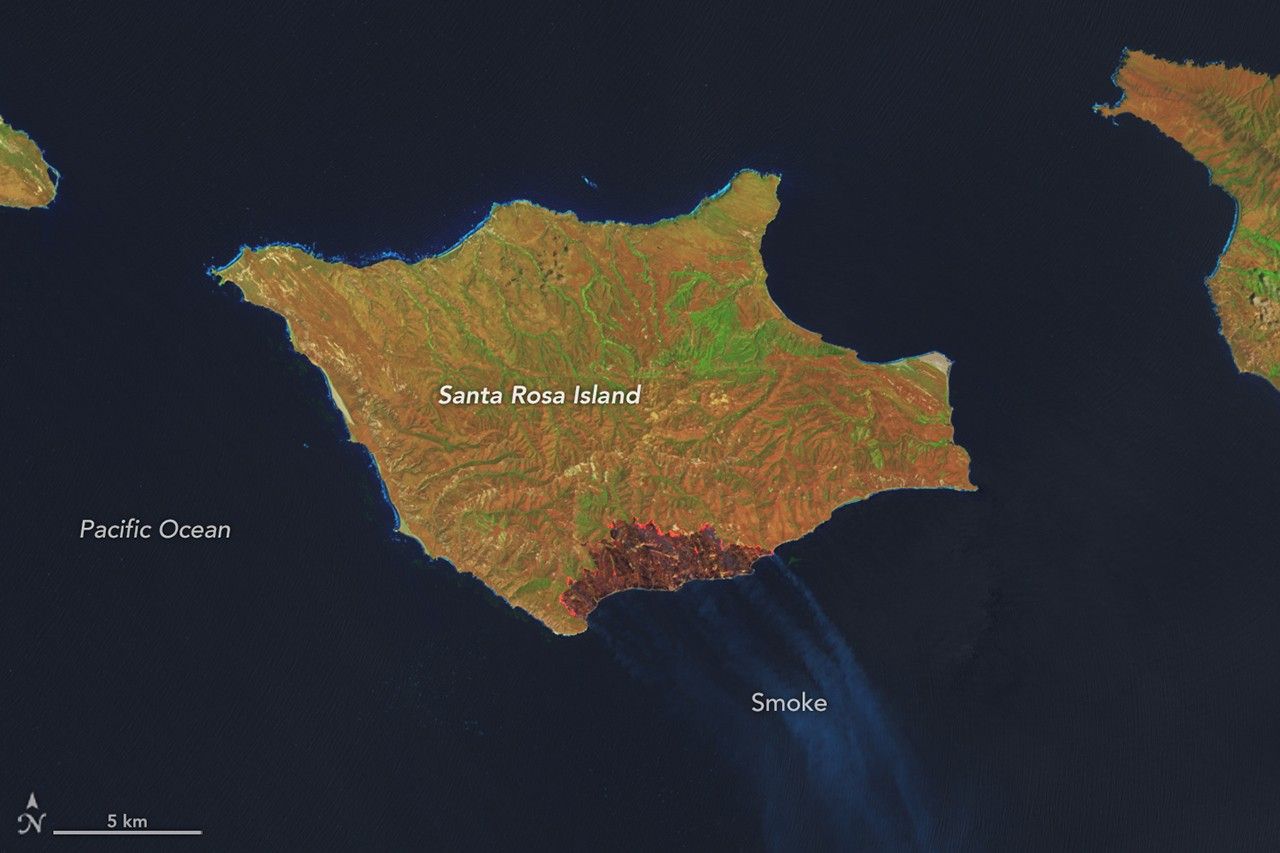


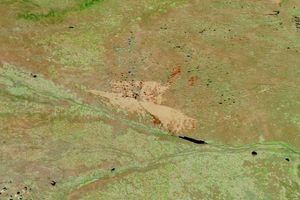
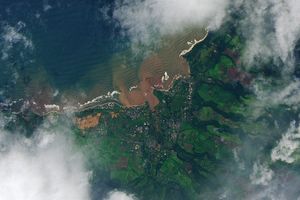
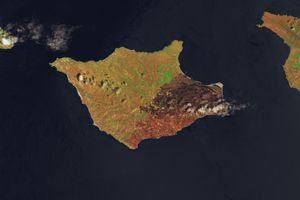
On May 15, 2026, a fire was spotted from aircraft on the southeastern side of Santa Rosa Island, part of California’s Channel Islands National Park. The blaze spread over the next several days, ultimately burning 18,379 acres (7,438 hectares)—about one-third of the island.
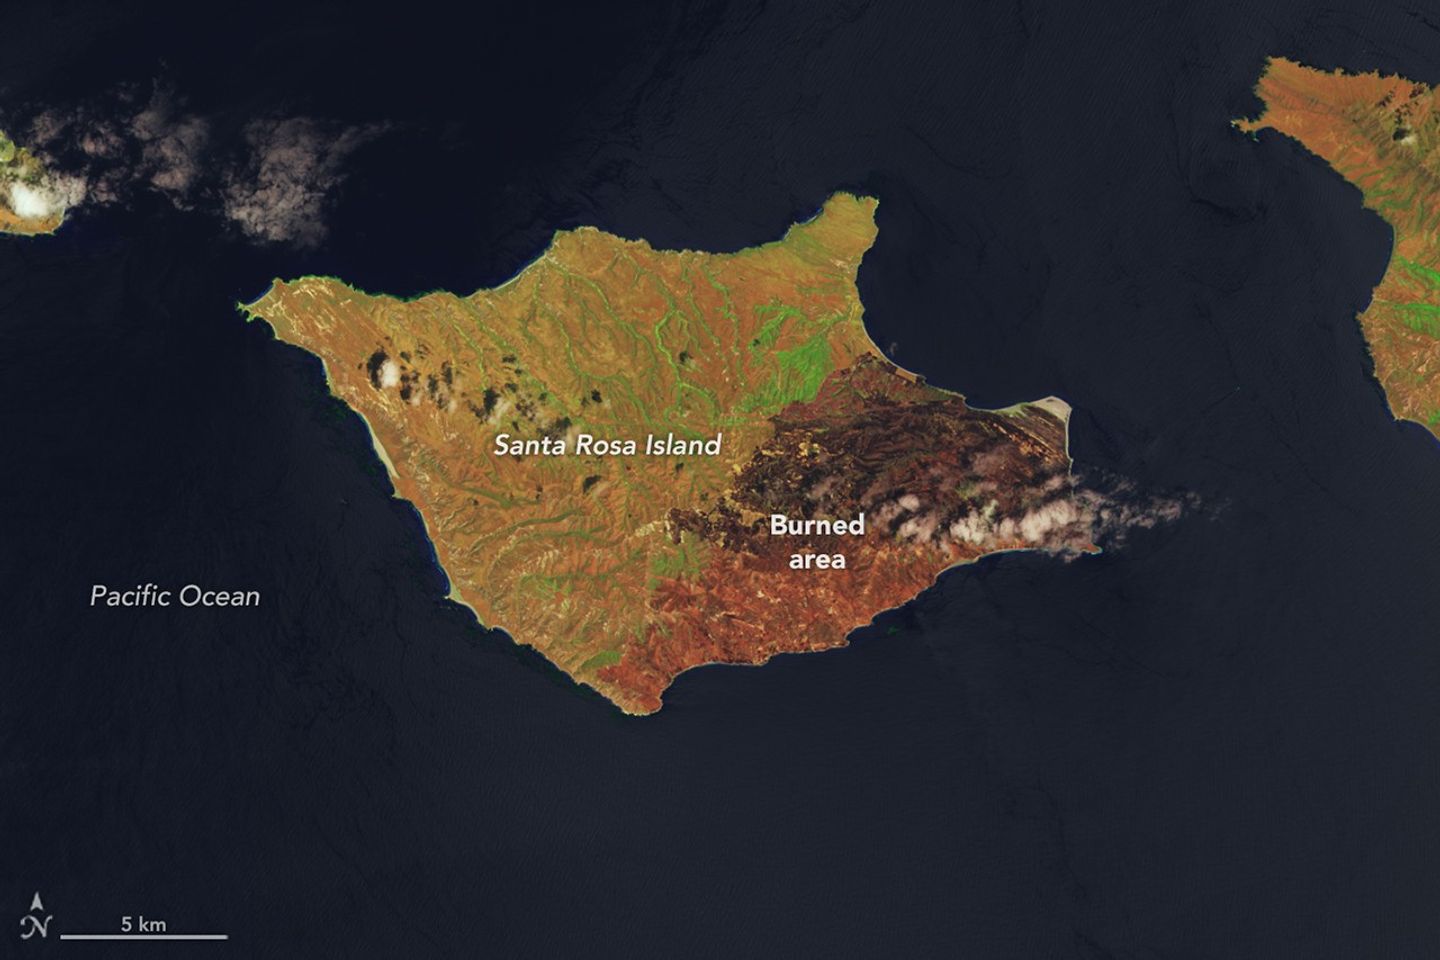
These images show the expansion of the fire’s burned area between May 16 (left), the day after it was discovered, and May 24 (right), after the fire’s growth had stabilized. The Landsat satellite images are false-color to help distinguish burned areas (brown) from healthy vegetation (green). Officials reported the fire was 97 percent contained by the evening of May 26.
NASA tools utilizing satellite observations, namely FIRMS (Fire Information for Resource Management System) and the Fire Event Explorer, show how the fire spread to the north and east over several days. As it advanced, it consumed areas of grassland, coastal sage scrub, and island chaparral.
Santa Rosa Island, like the other Channel Islands, is known for its diversity of plant and animal species, some of them rare. Observers were concerned that the fire threatened the island’s Torrey pines, a rare type of tree that in the United States grows naturally only on the northeastern coast of Santa Rosa Island and near San Diego.
Initial post-fire surveys by firefighters and unmanned aircraft indicated the Torrey pine stand remained largely intact. The fire mostly burned at lower intensity through the pine areas and spared the canopy. However, some pockets of forest sustained damage where intensity was higher. Along the northwest edge of the fire, suppression crews worked to protect another vulnerable area—the cloud forests—by cooling fuels ahead of the fire’s front.
Local reports suggest the Santa Rosa Island fire is the largest on record on any of California’s Channel Islands. Some of the islands’ chaparral and tree species are adapted to fire but less dependent on it than their mainland counterparts, according to the National Park Service, because naturally occurring fire is less frequent on the Channel Islands.
NASA Earth Observatory images by Lauren Dauphin, using Landsat data from the U.S. Geological Survey. Story by Lindsey Doermann.
References & Resources
- Capital Public Radio (2020) California Wildfire History Map. Accessed May 29, 2026.
- InciWeb (2026, May 28) Santa Rosa Island Fire. Accessed May 29, 2026.
- NASA Earth Observatory (2026, May 20) Fire Chars Santa Rosa Island. Accessed May 29, 2026.
- National Park Service, Channel Islands. Accessed May 29, 2026.
- Santa Barbara Independent (2026, May 21) What We’re Losing in the Santa Rosa Island Fire. Accessed May 29, 2026.
You may also be interested in:
Stay up-to-date with the latest content from NASA as we explore the universe and discover more about our home planet.

The blaze spread across the southern side of the second-largest island in California’s Channel Islands National Park.
Dry, warm, and windy conditions across the U.S. Great Plains led to extreme fire activity in March 2026.

The National fire has burned tens of thousands of acres within the Florida preserve, fueled by vegetation dried by prolonged…


The post Fire’s Footprint on Santa Rosa Island appeared first on NASA Science.
Gravity Waves From Super Typhoon Sinlaku
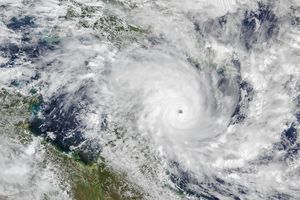
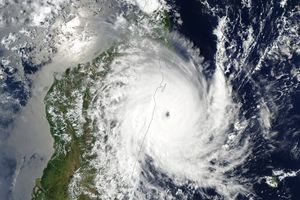
In mid-April 2026, Super Typhoon Sinlaku churned across the North Pacific Ocean and brought heavy rain and flooding to the Mariana Islands. The storm reached “violent typhoon” status—the highest intensity on the scale used by the Japan Meteorological Agency and roughly equivalent to a category 5 storm on the Saffir-Simpson wind scale. Sinlaku was one of only a handful of tropical cyclones of that intensity known to have occurred so early in the year in the region, meteorologists noted.
Sinlaku rapidly intensified over the ocean before its impacts reached land. Around the time of this strengthening, satellites began to detect that the typhoon’s effects also extended upward, into the upper atmosphere.
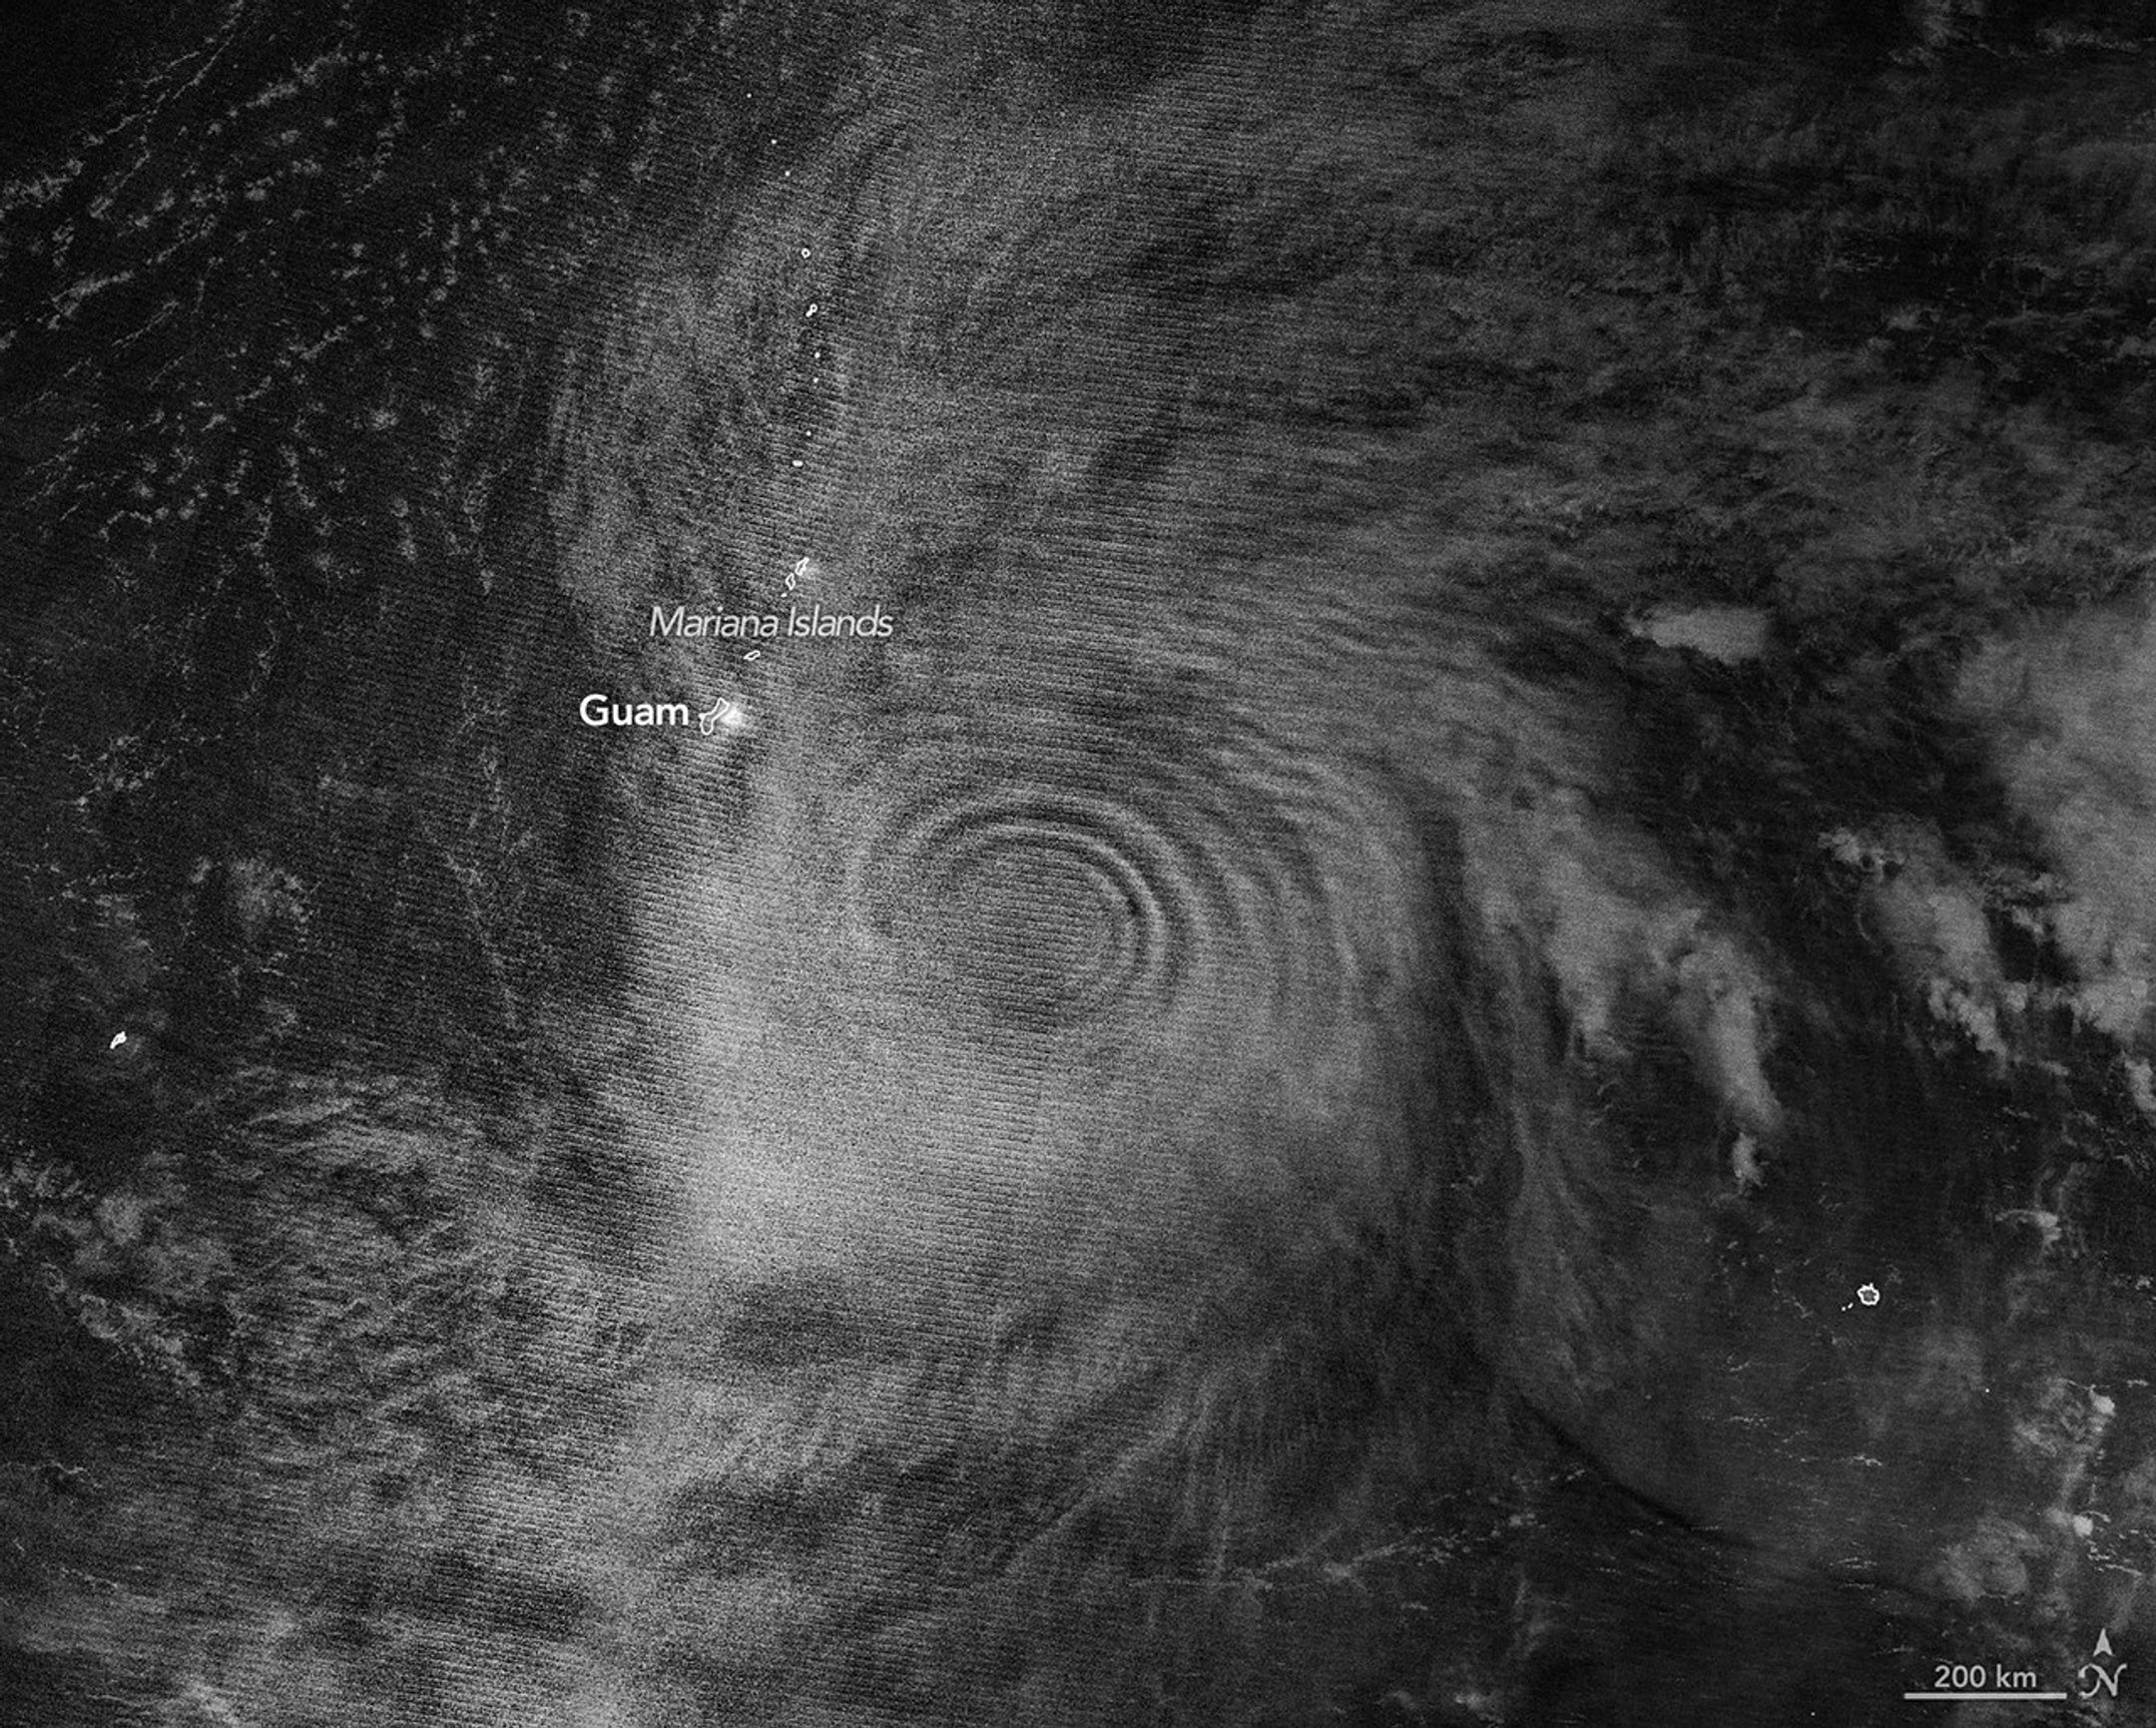
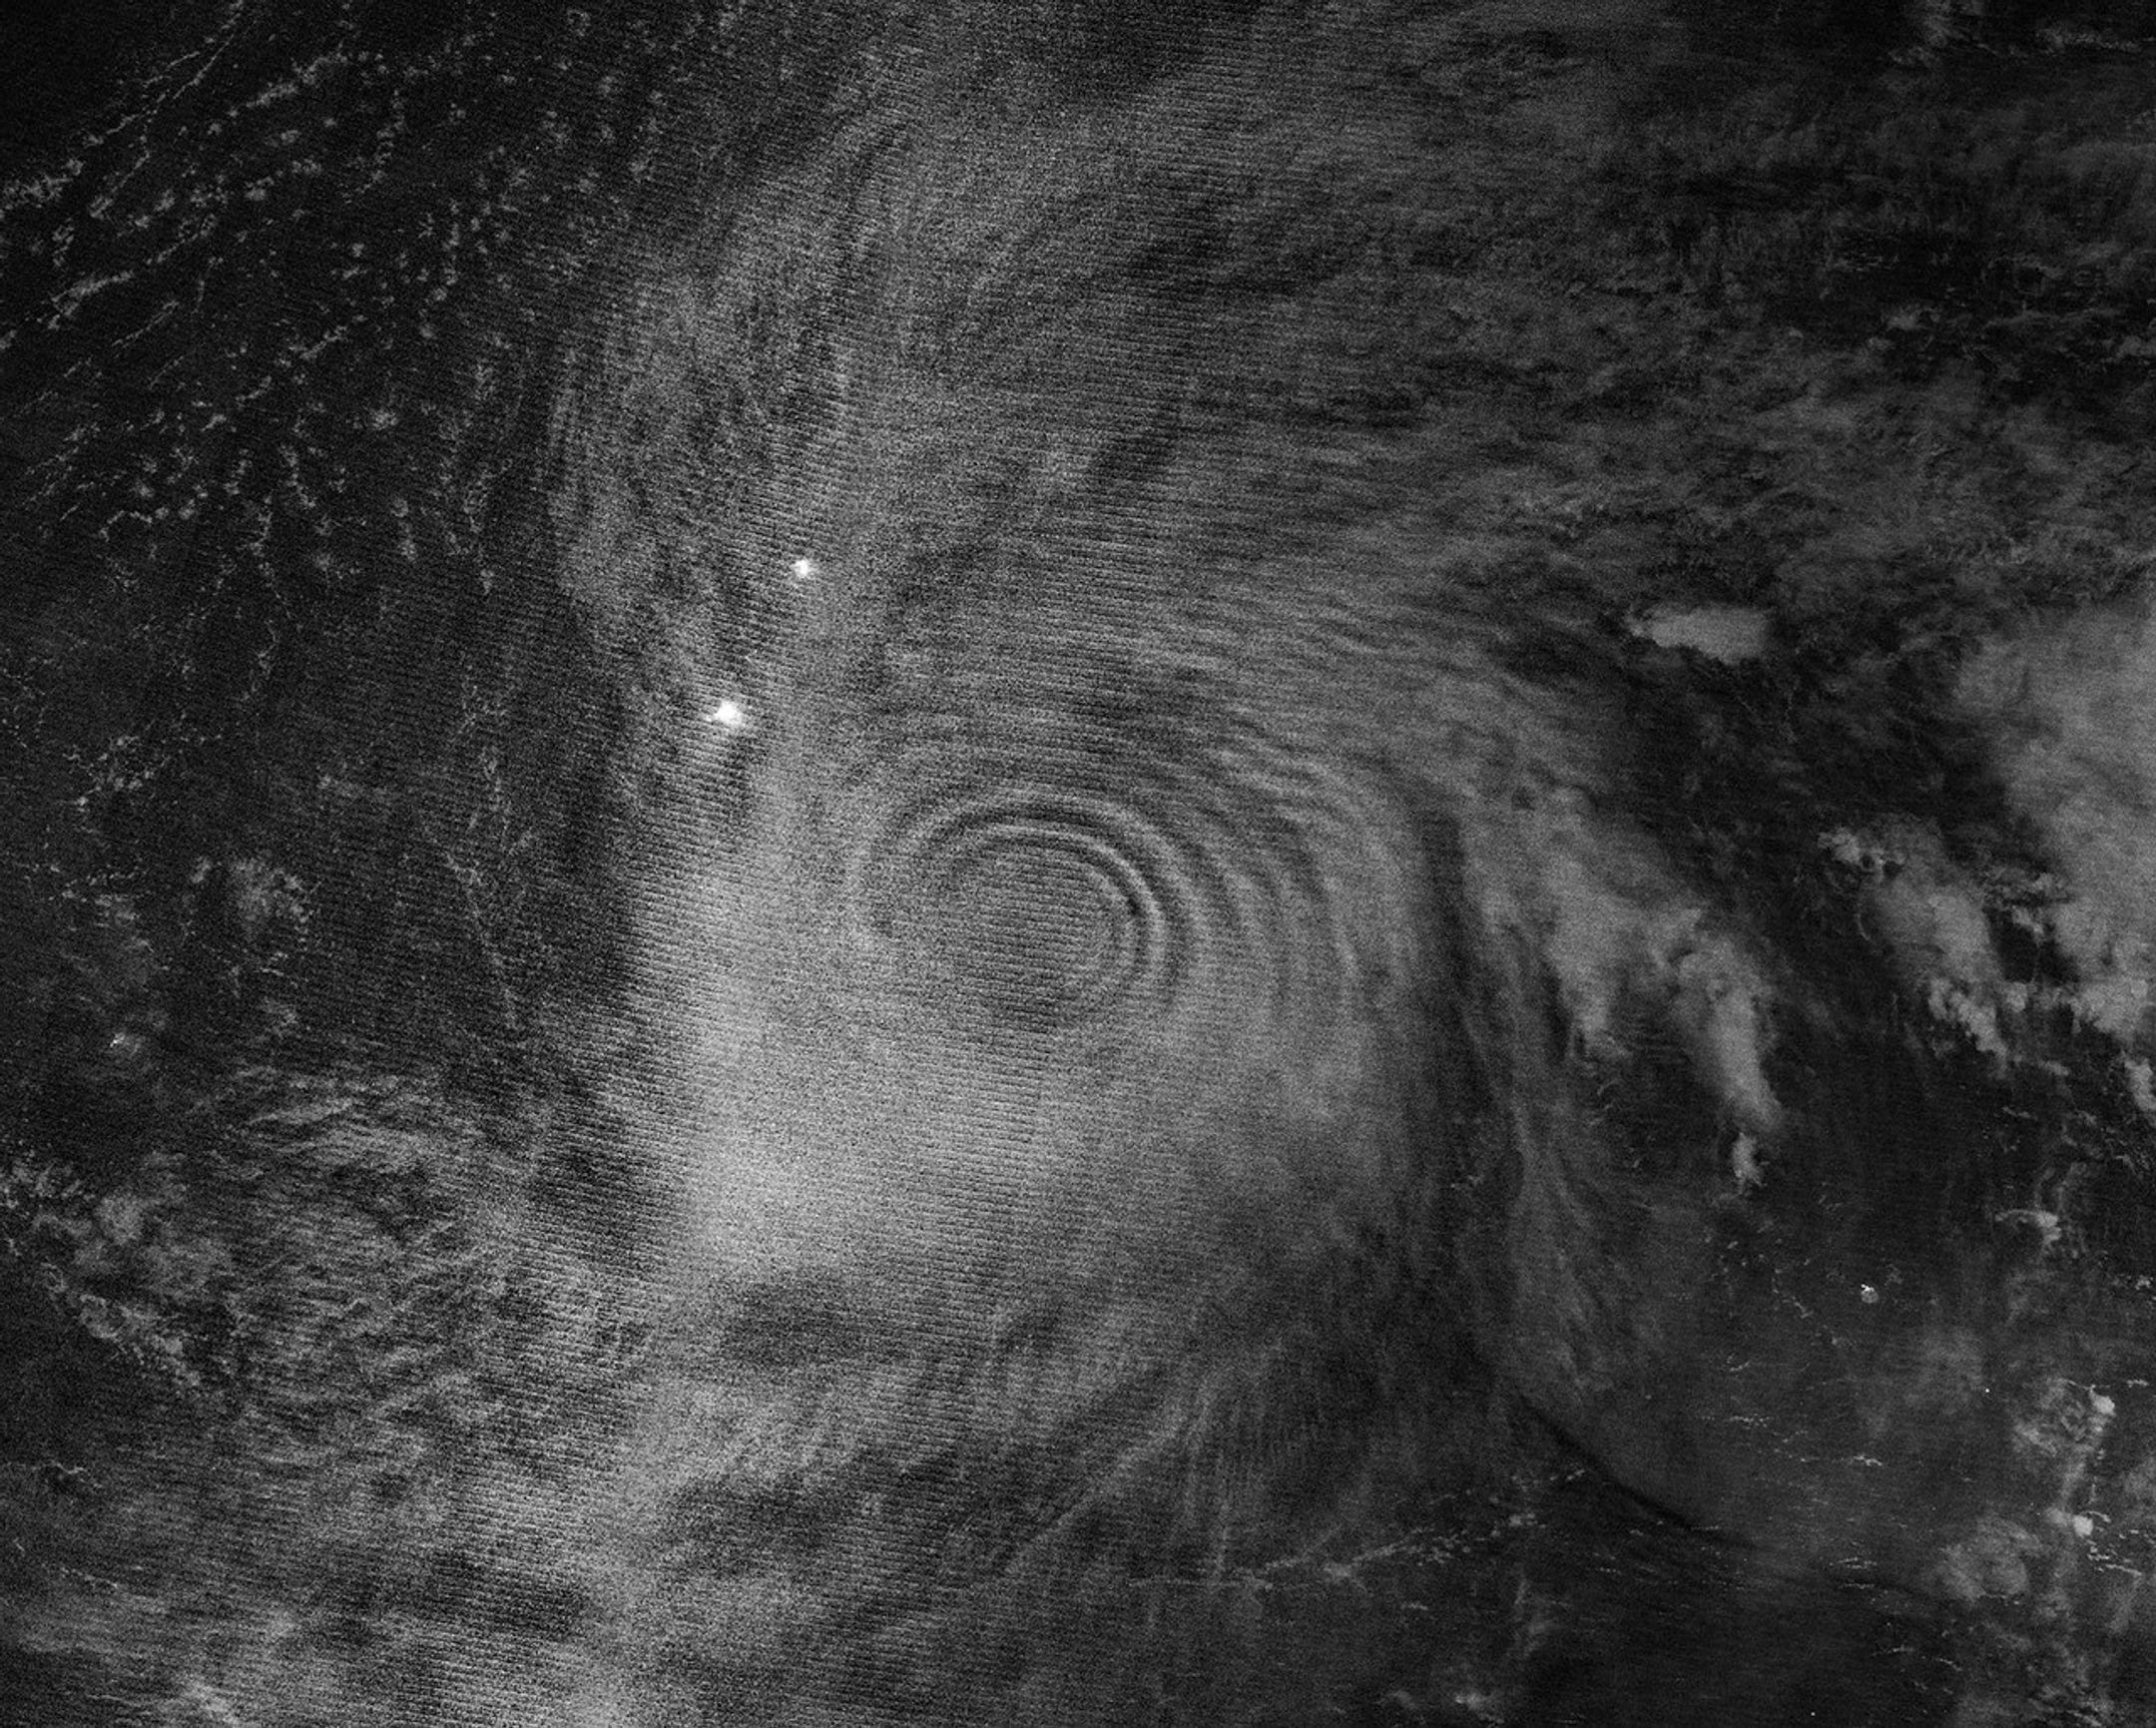
The nighttime image above, acquired with the VIIRS (Visible Infrared Imaging Radiometer Suite) on the NOAA-20 satellite, shows atmospheric gravity waves radiating from the typhoon. These waves, resembling ripples on a pond, were made visible to the sensor via airglow in the mesosphere. Airglow occurs when atoms and molecules, excited by sunlight during the day, later emit light to release excess energy.
The release of latent heat near the eyewalls of tropical cyclones is known to drive convection and the formation of tall cumulonimbus clouds. These “hot towers” can rise out of the troposphere, the lowest layer of the atmosphere, and generate waves that propagate into the stratosphere and mesosphere above. An analysis of past tropical cyclones revealed that gravity waves often occur around the time that storms are intensifying. Indeed, in the 24 hours prior to the acquisition of the image above, Sinlaku had strengthened from a category 2 to a category 5 storm.
“We’re seeing waves propagating radially and upward, in a cone-like shape,” said Joan Alexander, senior research scientist at NorthWest Research Associates. Alexander was surprised to see nearly complete rings in the mesospheric airglow above the storm. Winds in the upper atmosphere can dissipate the waves before they reach such high altitudes, Alexander explained, but relatively light stratospheric winds at the storm’s latitude in April 2026 may have helped preserve them.
A relatively low amount of moonlight was fortuitous, as well. The VIIRS day-night band is sensitive to airglow in the mesosphere but also observes reflected moonlight. The Moon was about 25 percent illuminated on April 12, so some light reflected off clouds in the troposphere was visible, but not enough to overpower the signal from the airglow.

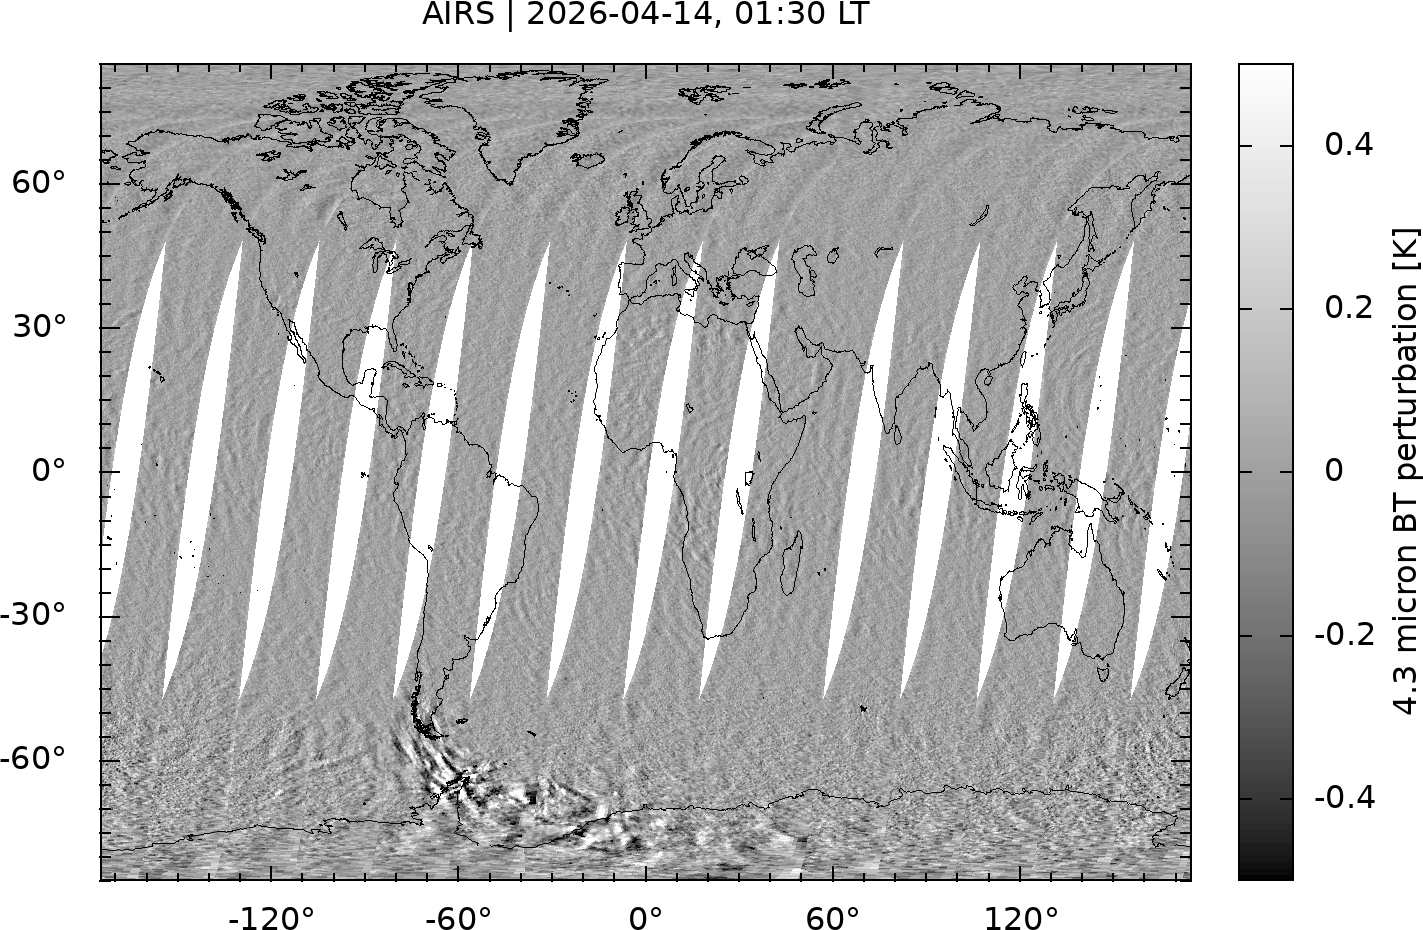
Sinlaku’s gravity waves, in addition to appearing high in the atmosphere via airglow, were observed lower in the atmosphere by the AIRS (Atmospheric Infrared Sounder) instrument on NASA’s Aqua satellite. The image above depicts thermal emissions from gravity waves in the stratosphere on April 13. The rippling pattern appeared in April 14 observations, as well, indicating the storm’s continuing effects on the atmosphere.
Observing atmospheric gravity waves, particularly those caused by tropical cyclones, goes beyond scientific curiosity. Practical implications could include improved monitoring of storm development. “We’d like to use gravity waves to tell us if a storm is intensifying,” Alexander said, “which can be difficult to know, especially over the open ocean.” A geostationary satellite with the proper infrared imager would be able to observe gravity waves and track tropical cyclone evolution, she and colleagues have argued.
Furthermore, it’s critical to account for processes in the stratosphere in weather models, said Laura Holt, also a senior research scientist at NorthWest Research Associates. Stratospheric wind patterns are factors in long-term forecasts of the next Northern Hemisphere winter, for example, and tropical cyclones have a disproportionate influence because their sustained, intense convection drives prolonged gravity wave forcing of the stratosphere.
The effect of gravity waves even reaches into the realm of space weather. “For a while, people have seen signatures of hurricanes in ionospheric weather,” Holt said. Gravity waves can lead to traveling ionospheric disturbances—large-scale ripples in plasma density—and in some cases plasma bubbles, both of which can disrupt satellite signals and radio communications. “With space weather in particular,” Holt added, “a single event such as a tropical cyclone can be very important.”
NASA Earth Observatory images by Michala Garrison, using VIIRS day-night band data from NASA EOSDIS LANCE, GIBS/Worldview, and the Joint Polar Satellite System (JPSS), and AIRS data from Hoffmann, L. Story by Lindsey Doermann.

References & Resources
Hoffmann, L., et al. (2018) Satellite observations of stratospheric gravity waves associated with the intensification of tropical cyclones. Geophysical Research Letters, 45, 1692–1700.
NASA (2018, October 22) Why NASA Watches Airglow, the Colors of the (Upper Atmospheric) Wind. Accessed May 28, 2026.
NASA Earth Observatory (2026, April 14) Super Typhoon Sinlaku. Accessed May 28, 2026.
Nolan, D. S. (2020) An Investigation of Spiral Gravity Waves Radiating from Tropical Cyclones Using a Linear, Nonhydrostatic Model. Journal of the Atmospheric Sciences, 77, 1733–1759.
You may also be interested in:
Stay up-to-date with the latest content from NASA as we explore the universe and discover more about our home planet.

The violent storm aimed at the U.S. Northern Mariana Islands and Guam in mid-April 2026.
The powerful storm lashed the northern edge of the continent with damaging winds and drenching rain as it made landfall…
Widespread flooding affected tens of thousands of people after cyclones Fytia and Gezani drenched the island.
The post Gravity Waves From Super Typhoon Sinlaku appeared first on NASA Science.
Painting the Growing Season in the Maize Triangle
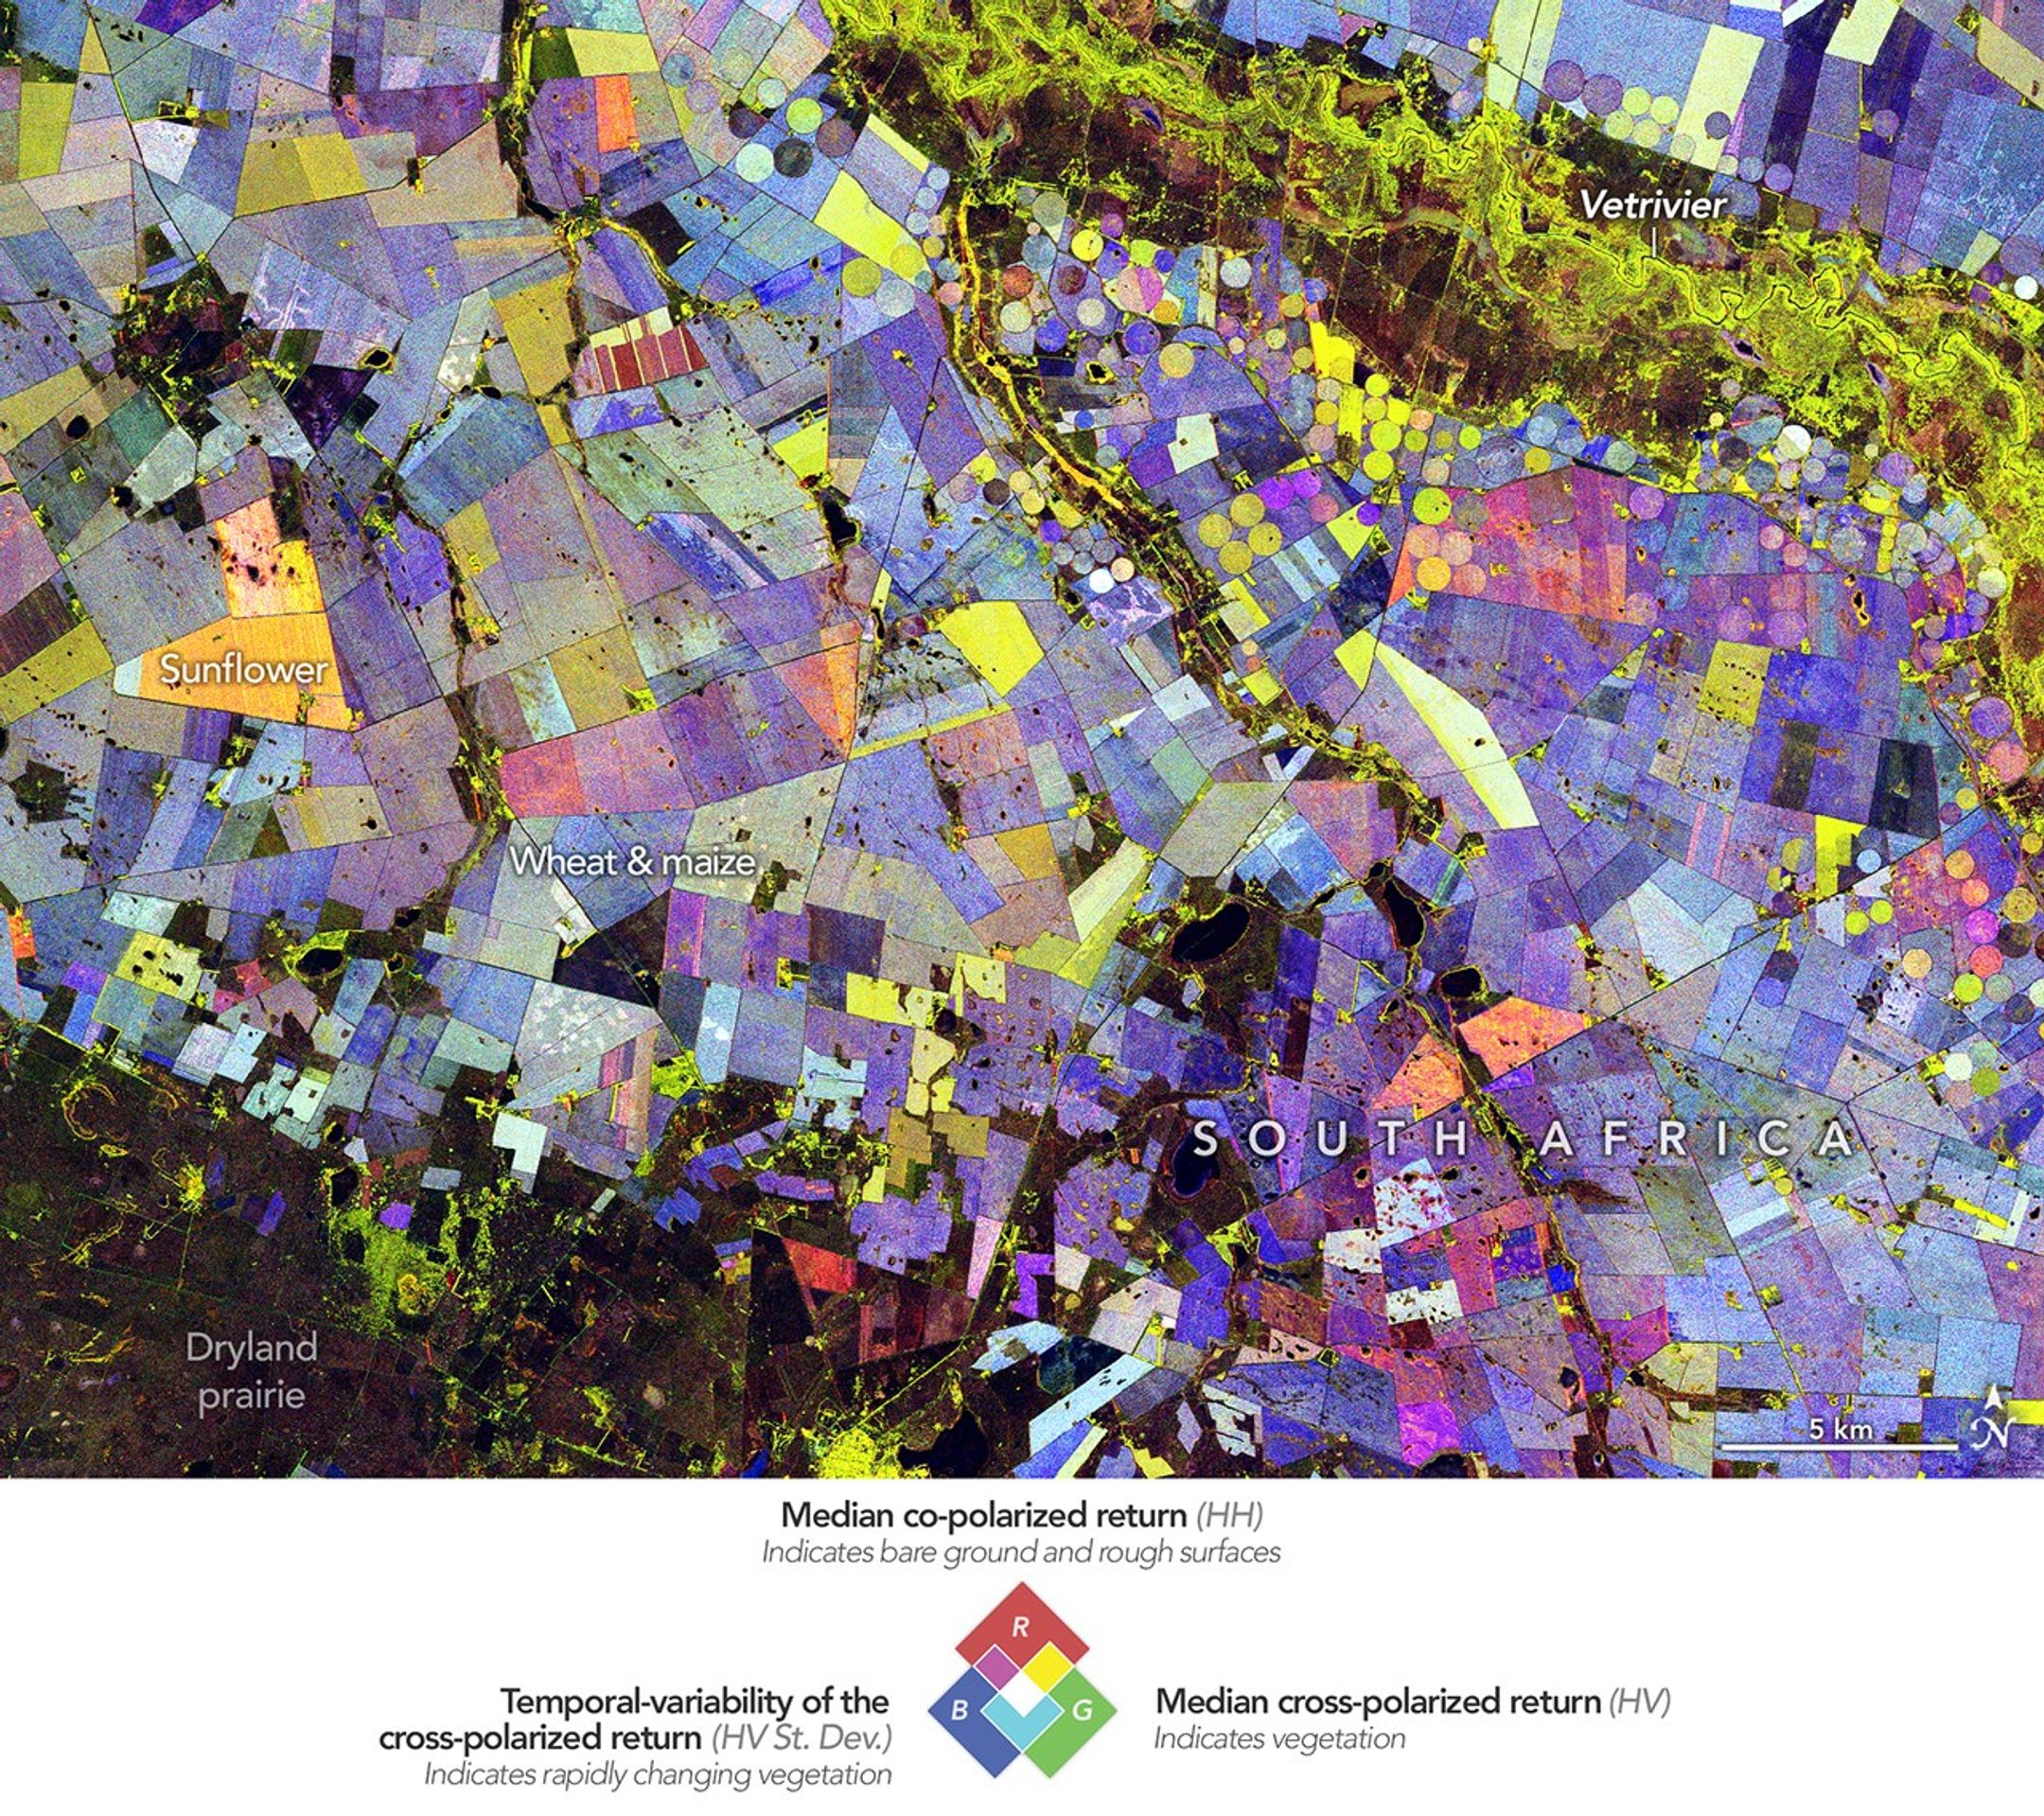
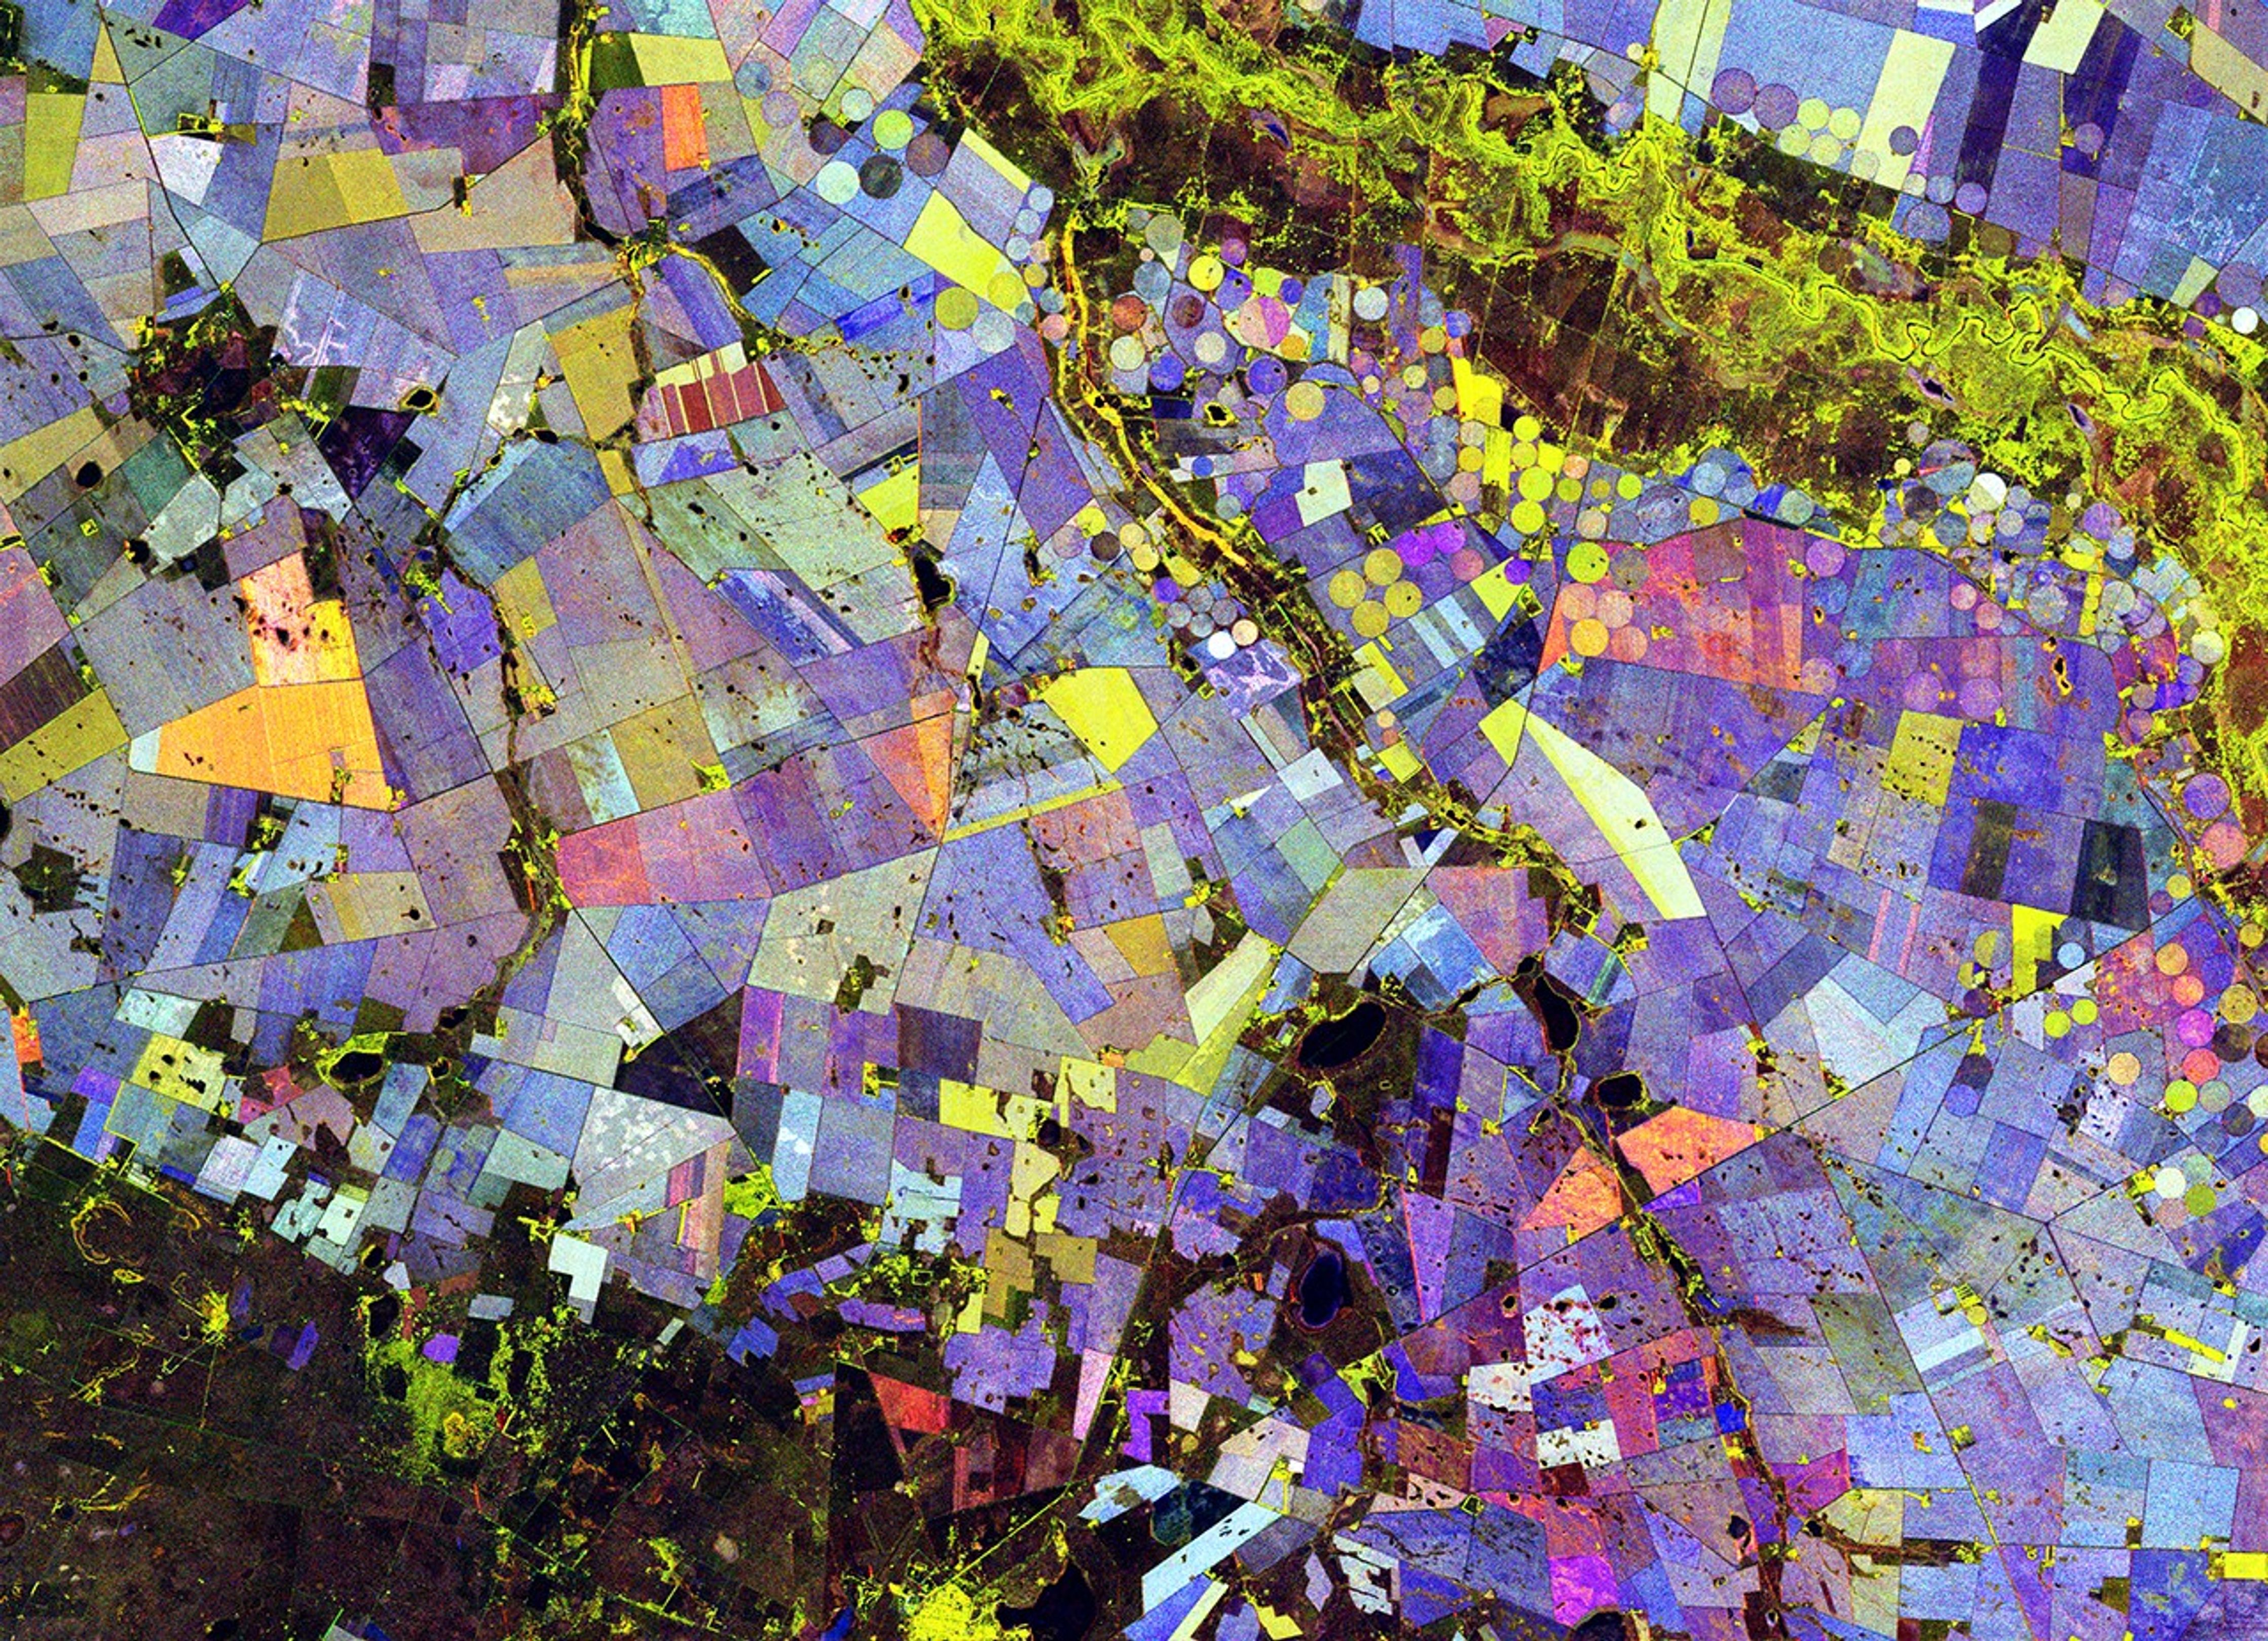
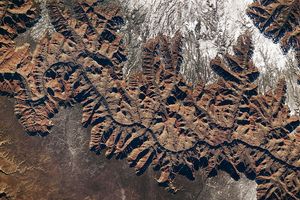
Along the Vetrivier (Vet River) in South Africa, a patchwork of circular and rectangular fields spreads across what is otherwise a semi-arid part of the Free State province. The water brings life to an array of crops, contributing to the agricultural productivity of the wider Maize Triangle.
The agricultural area shown in this image lies about 110 kilometers (70 miles) north of Bloemfontein. The scene is reminiscent of a modern abstract painting. Colorful circles mingle with straight-edged fields in combinations of red, green, and blue. But each color carries physical meaning, providing clues about crop types and revealing how they changed over the course of the Southern Hemisphere’s growing season.
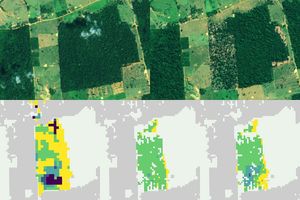
Data for the visualization were acquired by the NISAR (NASA-ISRO Synthetic Aperture Radar) satellite during 10 passes over the area between November 2025 and March 2026. L-band radar observations, which can “see” vegetation’s structure instead of its color, were analyzed to produce per-pixel statistical measures across the scene. By combining radar scattering behaviors observed across multiple dates into a single composite, scientists built a compact summary of seasonal agricultural activity and change.
“It’s a pretty picture, but there are also important things that it communicates to us,” said Paul Siqueira, a scientist at the University of Massachusetts Amherst, and ecosystems lead of the NISAR science team. “With NISAR, crops like maize and sunflower appear differently than forests because of their size differences and period of growth.”
In this false-color composite, green indicates a vegetated area; red represents an unvegetated surface; and blue indicates how rapidly a vegetated area changed over the season. For instance, stable vegetation—such as forested areas—display a light blue component. Plants that change structure throughout the season, such as wheat and maize (corn), have a darker blue component.
In practice, most pixels contain a mix of these colors, producing the visualization’s rich and varied palette. For example, plants that grow rapidly (contributing some green) and are harvested early (contributing a large red component) make fields appear orange. Sunflowers are known to exhibit this pattern in the region, though ground validation would be needed to confirm their presence in any given field.
The processing behind the visualization is relatively straightforward, but it is based on a large amount of data. NISAR sends radar signals to Earth and measures how they bounce back; the orientation of the returned radar waves (cross-polarized or co-polarized) carries information about the structure of vegetation and surfaces. By combining radar measurements from multiple satellite passes and calculating statistics for each pixel, scientists built the detailed map of the landscape’s characteristics throughout the growing season.
The technique provides a repeatable way to monitor crop development, the impacts of irrigation, and land-use change across large regions. As NISAR collects more data, researchers will be able to compare seasons, track field-to-field differences in growth patterns, and better understand how agricultural systems respond to water availability and climate variability.
Image by Paul Siqueira (UMass Amherst) of the NISAR science team using data from the NISAR GCOV product, and prepared for NASA Earth Observatory by Michala Garrison. Story by Kathryn Hansen.
References & Resources
- NASA (2025, July 25) Get to Know SAR – Overview. Accessed May 28, 2026.
- NASA (2026, April 14) NISAR. Accessed May 28, 2026.
- NASA (2026, April 14) NISAR Handbook. Accessed May 28, 2026.
- NASA (2025, July 23) Polarimetry. Accessed May 28, 2026.
You may also be interested in:
Stay up-to-date with the latest content from NASA as we explore the universe and discover more about our home planet.
From autumn color to a winter-white finish, forested areas around Blacksburg trade foliage for snow over the span of two…
Scientists pioneered a new system that combines data from multiple Earth-observing satellites to identify forest clearing up to 100 days…

The circular geologic feature in northwestern Africa can be hard to recognize from the ground, but it is obvious when…
The post Painting the Growing Season in the Maize Triangle appeared first on NASA Science.
A Shift in What’s Shaping U.S. Landscapes
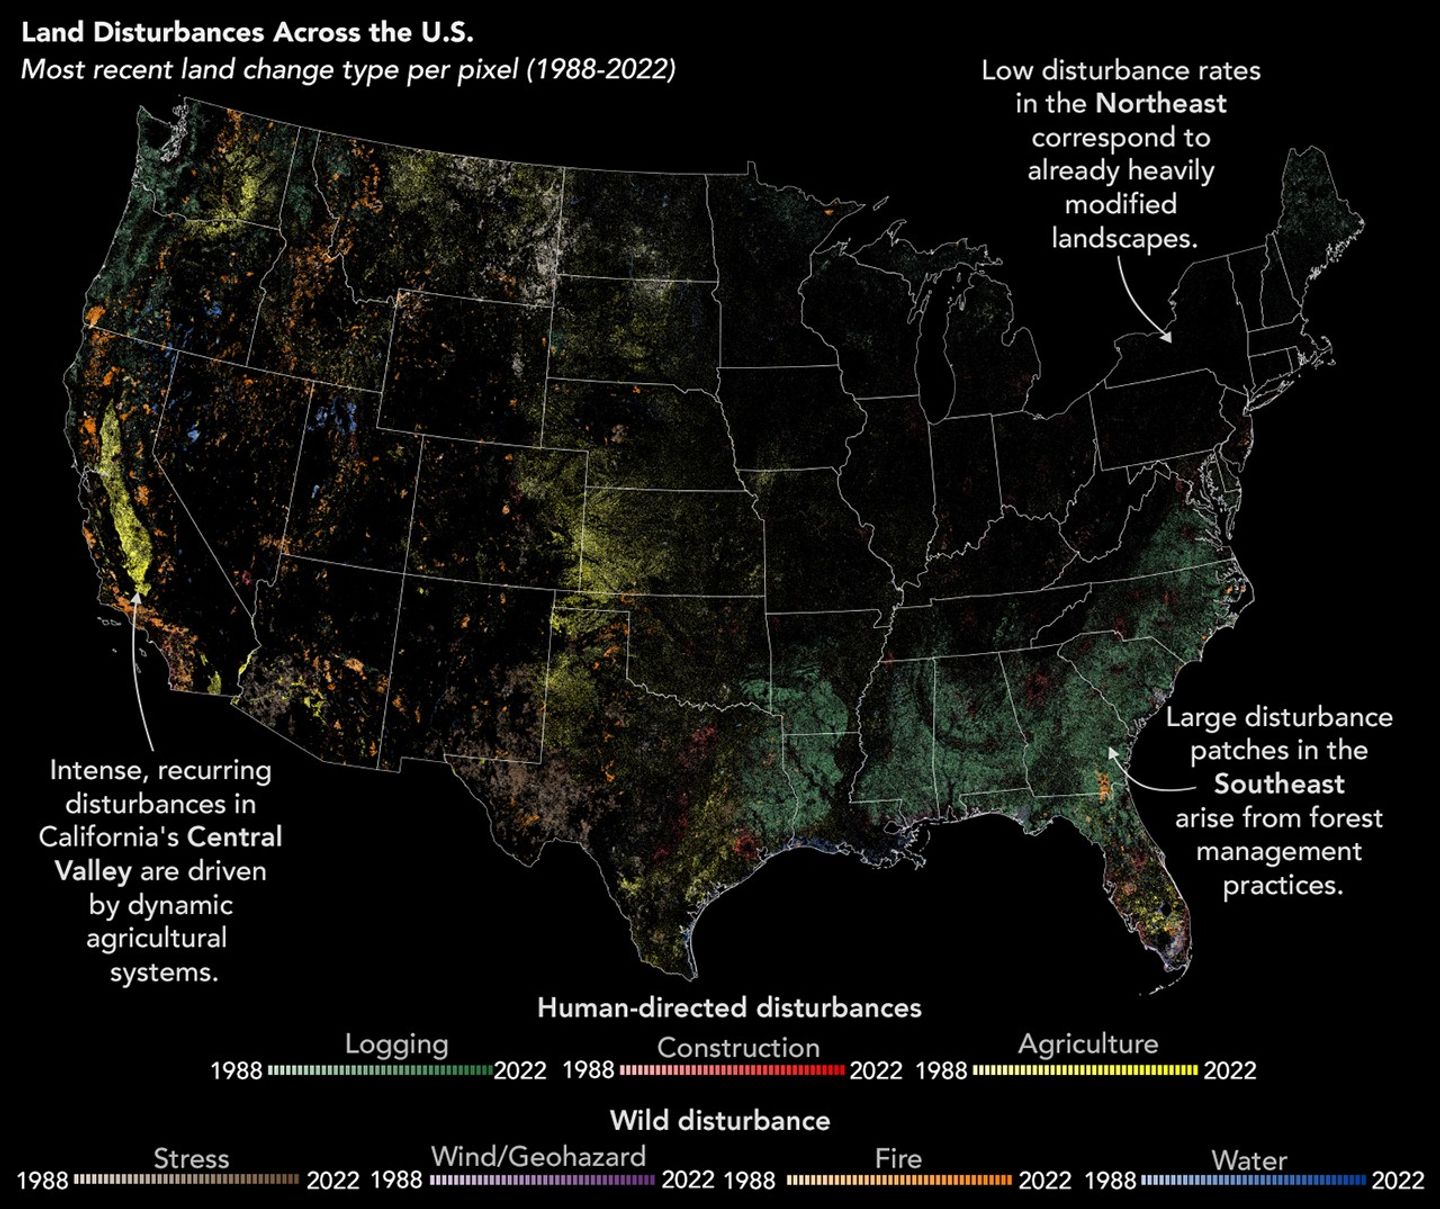
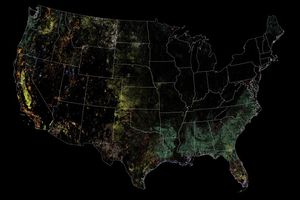
The land is always changing, sometimes by human hands: cities are built, farms expanded, and forests logged. Other changes lie mostly outside people’s control: wildfires burn through communities, and hurricanes reshape coastlines. For most of the past four decades, observations from the Landsat satellite record show that humans have dominated changes to the U.S. landscape. Recent research revealed a shift in that trend, suggesting that disasters might be catching up.
In a NASA-funded study published in Nature Geoscience, scientists analyzed nearly 35 years of data from NASA/USGS Landsat satellites to better understand what has been shaping the continental U.S. landscape. The researchers, led by former Landsat science team member Zhe Zhu, found that “human-directed disturbances” like logging, agricultural expansion, and construction have declined, while “wild disturbances” like wildfires and hurricanes—disasters that can be influenced by human activity but are not controlled by people—have risen in frequency and intensity.
Robert Emberson, associate program manager for the NASA Disasters program and not affiliated with the study, said that understanding the forces transforming the U.S. landscape is critical for future planning. “If you know what’s causing them, you can begin to plan around disasters,” Emberson said. “Any understanding of causal factors impacts the adaptation strategy.”
This research is especially useful for policymakers working to prepare communities for resilience, he said. For example, a region expecting to see increased wildfires could strategically perform prescribed burns, remove brush or dry grass around homes, and construct new buildings with fire-resilient materials.
Between 1988 and 2022, 18 percent of the land area in the continental U.S. was disturbed at least once, the researchers found. Adding repeated disturbances, the cumulative area disturbed rises to almost 700,000 square miles, equivalent to nearly one-third of the continental U.S. Humans drove more than half of that change, clearing or developing over 446,000 square miles of land—that’s bigger than the size of Texas and California combined. For example, the animation above, composed of Landsat images from 1985 to 2025, shows the expansion of Reno, Nevada, into a previously undeveloped desert landscape.
Meanwhile, wild disturbances—disasters like wildfires, hurricanes, and landslides—drove much of the remaining change, transforming more than 165,000 square miles of the continental U.S. The Landsat images in the animation below show areas burned by wildfires in Eldorado National Forest west of California’s Lake Tahoe from 1985 to 2025. Major fires in 1992, 2014, and 2022 cleared large swathes of forest, leaving behind bare ground that slowly reforested.
Although human activity has disturbed a larger cumulative area than wild events, the trends over time are moving in opposite directions. That is, land disturbance caused directly by people has been decreasing, while wild disturbance has been increasing.
Specifically, human-directed land disturbances decreased by nearly 232 square miles (600 square kilometers) each year over the course of the study period. Researchers attribute this change to declines in construction, agricultural expansion, and logging, likely brought about by a combination of policy changes, technological improvements, and the 2008 financial crisis’s effect on construction.
In contrast, land affected by wild disturbances increased by more than 77 square miles (200 square kilometers) per year. Fire, drought-related stress, and wind disturbances all became more frequent, likely due to climate warming and other environmental factors, the study authors wrote.
“What this study basically tells me is that what we’ve been doing is not working,” said Ramakrisna Nemani, a retired NASA scientist and co-author on this study. “We have to go back and come up with new strategies on how to deal with these natural disturbances.”
The study’s findings drew on the deep archive of Landsat data, which has long been a key resource for detecting change on Earth’s surface. Think of it like a “spot-the-difference” game. Historically, identifying differences between images required scientists to manually identify the source of the change; for example, using ground observations combined with satellite imagery to determine whether a bare spot resulted from wildfires or logging. For this study, scientists trained a new machine-learning algorithm to do that differentiation work for them.
They fed the algorithm 40 years of land-change data acquired by satellites, manually inspecting and identifying changes at 50,000 locations. After a decade of work, they developed a product that achieves more than 75 percent accuracy across most disturbance types.
The resulting product details the causes of disturbance across the continental U.S. over the course of nearly 35 years. With this information, communities can analyze the past to better plan for the future. “The USA is entering a new era of disturbance,” the study authors wrote. “The challenge now is to transform our relationship with disturbance from one of control to one of coexistence.”
NASA Earth Observatory image by Lauren Dauphin, based on data from Qiu, S. et al. Animations by Ross Walter, Landsat Project Science Support. Story by Madeleine Gregory, Landsat Project Science Support.

References & Resources
- Qiu, S. et al. (2025) A shift from human-directed to undirected wild land disturbances in the USA. Nature Geoscience, (18) 989-996.
You may also be interested in:
Stay up-to-date with the latest content from NASA as we explore the universe and discover more about our home planet.

Once a month during the full Moon, Landsat 9 turns from Earth to image the lunar surface, helping keep the…
From autumn color to a winter-white finish, forested areas around Blacksburg trade foliage for snow over the span of two…
Scientists pioneered a new system that combines data from multiple Earth-observing satellites to identify forest clearing up to 100 days…
The post A Shift in What’s Shaping U.S. Landscapes appeared first on NASA Science.
Ever Restless Mount Dukono Erupts

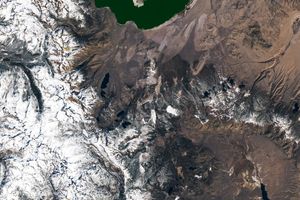
In May 2026, the Global Volcanism Program reported nine actively erupting volcanoes in Indonesia—more than any other country at the time. Such activity is typical for the Southeast Asian archipelago, where eruptions have occurred at 55 volcanoes since the 1960s—the highest total for any country. Japan ranks second with eruptions at 40 volcanoes over that time period, followed by the United States with 39, according to Global Volcanism Program data.
Even for such an eruption-prone country, the persistence of activity at Mount Dukono stands out. The remote stratovolcano, located at the northern end of Halmahera Island, has been erupting nearly continuously since 1933, with near-daily rumbles and frequent emissions of ash and volcanic gases. The volcano routinely flings hunks of semi-molten rock, known as volcanic bombs, hundreds of meters from its vent.
This sort of activity at Dukono turned deadly on May 8, 2026, when ash and volcanic bombs rained down on a group of hikers. In the days following the tragedy, the mountain remained highly active. Indonesia’s volcanological survey reported an average of 52 eruptive events per day between May 9 and 16, with ash plumes rising 400 to 4,300 meters (1,300 feet to 14,000 feet) above the summit.
NASA and other U.S. government satellites detected thermal anomalies, ash plumes, and sulfur dioxide emissions in recent days. Indonesian authorities have set the alert level at 2 (on a scale of 4) and warned the public to stay at least 4 kilometers (2 miles) from the crater.
NASA Earth Observatory image by Lauren Dauphin, using Landsat data from the U.S. Geological Survey. Story by Adam Voiland.

References & Resources
- Center for Volcanology and Geological Hazard Mitigation (2026) MAGMA Indonesia. Accessed May 26, 2026.
- CNN (2026, May 9) Multiple hikers killed, others rescued after volcano erupts in Indonesia. Accessed May 26, 2026.
- Global Volcanism Program (2026, May 14) Weekly Volcanic Activity Report. Accessed May 26, 2026.
- Global Volcanism Program (2026, March 31) Which countries have the most volcanoes? Accessed May 26, 2026.
- The Ministry of Energy and Mineral Resources (2026) Gunung Dukono Kembali Erupsi, Masyarakat Diminta Waspadai Sebaran Abu Vulkanik. Accessed May 26, 2026.
- Mirova (2026, May 26) Dukono. Accessed May 26, 2026.
- Mounts (2026, May 26) Dukono. Accessed May 26, 2026.
- Oregon State University (2026) Dukono. Accessed May 26, 2026.
You may also be interested in:
Stay up-to-date with the latest content from NASA as we explore the universe and discover more about our home planet.
The Tongan volcano expanded its mid-Pacific real estate during its latest eruptive phase.
A massive, old caldera and more recently formed craters shape the landscape in the eastern Sierra Nevada.
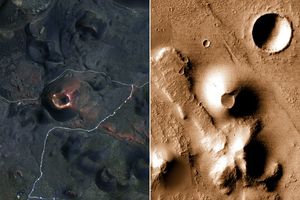
The hill-shaped features are a sign of explosive volcanic activity—a rarity on the Red Planet.
The post Ever Restless Mount Dukono Erupts appeared first on NASA Science.
A Full Moon Checkup
In April 2026, NASA’s Artemis program took humanity back to the Moon, providing a new look at Earth’s only natural satellite. As the world celebrates the return of Artemis II’s four astronauts, the lunar surface continues to play a critical role in missions much closer to Earth.
Since 1972, the NASA/USGS Landsat program has captured the longest continuous record of Earth’s land surface, collecting images that track everything from crop health to glacial change. But with such a long data record, how can scientists trust that images acquired today can be accurately compared to those from days, years, or even decades ago? They look to the Moon.
Unlike Earth, with its constantly changing weather, seasons, and landscape, the Moon is remarkably stable. With no atmosphere and virtually no surface changes, the Moon reflects sunlight in a predictable, consistent way. This stability gives engineers a reference to fine-tune Landsat’s instruments and be confident that the data are accurate.
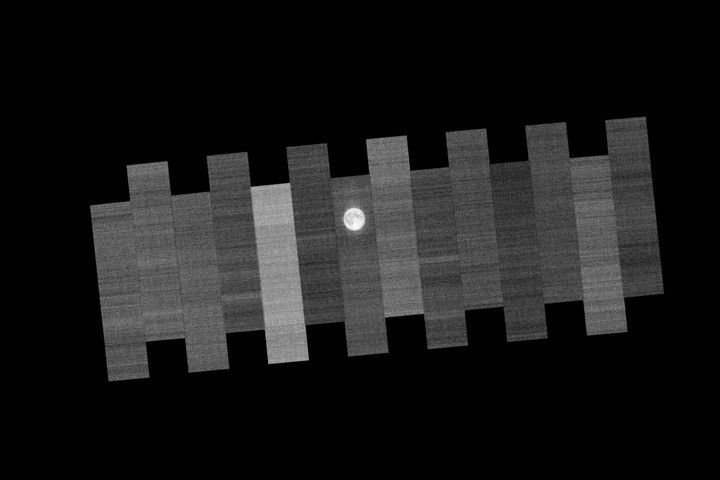
Once a month, during the full Moon, the spacecraft turns its instruments away from Earth and points them directly at the lunar surface. Over the course of two orbits, the spacecraft maneuvers to image the moon 15 times. During each pass, Landsat captures detailed measurements of light reflected off the Moon’s surface, revealing any unintended sensor change, or “drift,” that needs correction.
The animation above shows the scans acquired by band 4 of the OLI (Operational Land Imager) on Landsat 9 on January 3, 2026. Each parallel scan was acquired by one of the 14 detector modules that comprise the instrument’s focal plane. The satellite maneuvers so that each module images the Moon, with one module capturing it twice.
This work is one piece in a complex puzzle called calibration, which is part of what makes NASA the gold standard of science worldwide. From before launch all the way to the end of a satellite’s life, engineers ensure that the data collected by the satellite is accurate and consistent. In addition to looking to the Moon, Landsat also looks to places on Earth where the ground is uniform, like the wide, pale expanse of the White Sands desert in New Mexico.
Scientists also collect measurements on the ground to check against those collected from space. For example, they ensure that surface temperature readings match those recorded by Landsat’s thermal band. All these efforts are part of what make a Landsat image different from photos taken by consumer cameras. Landsat images contain crucial information that scientists can use to map changes in habitats, tree species, agricultural patterns, and more.
Video and animation by Ross Walter, using Landsat data from the U.S. Geological Survey. Story by Ross Walter and Madeleine Gregory, Landsat Project Science Support.
References & Resources
- Landsat Project Science Support (2025, December 16) Maintaining the Gold Standard: The Future of Landsat Calibration and Validation. Accessed May 22, 2026.
- NASA (2025, December 2) Calibration & Validation. Accessed May 22, 2026.
- NASA Earth Observatory (2022, July 5) Landsat Looks at the Moon. Accessed May 22, 2026.
- NASA’s Scientific Visualization Studio (2014, July 11) Landsat 8 Lunar Calibration. Accessed May 22, 2026.
You may also be interested in:
Stay up-to-date with the latest content from NASA as we explore the universe and discover more about our home planet.
Wild disturbances are on the rise, while land disturbed by human activity has been decreasing.

The crew of NASA’s Artemis II mission captured extraordinary images of our home planet during their journey around the far…

A series of nighttime satellite images revealed how moonlight reaching Earth varied throughout a total lunar eclipse.
The post A Full Moon Checkup appeared first on NASA Science.
An Early “Decoration Day” Celebration

The origins of Memorial Day lie in the U.S. Civil War, a conflict that led to the deaths of nearly 700,000 Americans. By the waning days of the war, makeshift military cemeteries had sprung up throughout the country, but especially in the South and Mid-Atlantic, where much of the fighting occurred.
By the time the leader of the veterans’ group Grand Army of the Republic declared May 30, 1868, as “Decoration Day”—a day for “strewing with flowers or otherwise decorating the graves of comrades who died in the defense of their country”—informal memorials and commemorative events were already happening.
The U.S. Department of Veterans Affairs notes that at least 25 places played a role in the early years of the holiday, including Columbus, Mississippi; Macon, Georgia; Columbus, Georgia; Richmond, Virginia; Boalsburg, Pennsylvania; and Carbondale, Illinois.
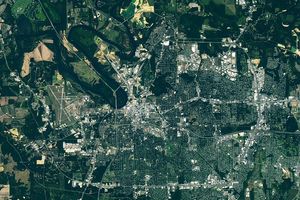
One of the earliest and largest ceremonies documented by historians occurred in Charleston, South Carolina. Confederate control of the badly damaged city had ended in February 1865, and Union troops had emancipated thousands of people there. Among the first tasks taken on was ensuring a proper burial for 257 soldiers found in mass graves near a racetrack at the Washington Race Course and Jockey Club, which had been used as a prison camp during the war.
After these soldiers had been re-interred in a new cemetery nearby, a crowd of roughly 10,000 people, including freedmen, missionaries, teachers, and soldiers, assembled at the racetrack and held a parade on May 1, 1865. The day featured thousands of schoolchildren carrying armloads of roses, women bearing flowers and wreaths, double-time marches by troops, choir performances of the “Star-Spangled Banner,” and Bible recitations by local ministers.
Much has changed in Charleston since the Civil War. The city has been rebuilt, and it has grown from a pre-war population of 40,000 to 160,000 today. Yet signs of the racetrack in what is now Hampton Park, where the early memorial event took place, remain visible—even to a sensor orbiting Earth on Landsat 9 (above).
In 1968, the federal government declared Memorial Day an official national holiday with the Uniform Monday Holiday Act, which moved Decoration Day celebrations from May 30 to the last Monday in May. This act followed a congressional resolution in 1966 that recognized a century of Memorial Day events in Waterloo, New York, acknowledging its claim as the “birthplace” of Memorial Day in honor of a commemorative event held there on May 5, 1866.

NASA Earth Observatory images by Michala Garrison, using Landsat data from the U.S. Geological Survey. Story by Adam Voiland.

References & Resources
- American Battle Monuments Commission (2014, May 23) From Decoration Day to Memorial Day: An American Tradition for Nearly 150 Years. Accessed May 21, 2026.
- American Battlefield Trust (2012, November 16) Civil War Casualties. Accessed May 21, 2026.
- Blight, D. (2015, April 27) The First Decoration Day. Accessed May 21, 2026.
- Charleston Area Branch of the Association for the Study of African American Life and History (2024, May 23) Decoration Day & Charleston’s Gullah Community: Honoring the Fallen First – Memorial Day. Accessed May 21, 2026.
- The College Today (2017, May 29) Memorial Day Uncovered: Charleston’s ‘Martyrs of the Race Course.’ Accessed May 21, 2026.
- The Historical Marker Database (2025, January 12) First Memorial Day. Accessed May 21, 2026.
- History.com (2026, May 4) One of the Earliest Memorial Day Ceremonies Was Held by Freed African Americans. Accessed May 21, 2026.
- National Archives (2018, May 24) The Nation’s Sacrifice: The Origins and Evolution of Memorial Day. Accessed May 21, 2026.
- National Archives (2024, May 23) Memorial Day: A Commemoration. Accessed May 21, 2026.
- National Cemetery Administration (2026) Memorial Day History. Accessed May 21, 2026.
- Time (2018, May 25) Lots of Places Claim to Be the Birthplace of Memorial Day. Here’s the Truth, According to an Expert. Accessed May 21, 2026.
- U.S. Army Airborne & Special Operations, The History of Memorial Day. Accessed May 21, 2026.
- U.S. Department of Veterans Affairs, The Origins of Memorial Day. Accessed May 21, 2026.
- WCBD News2 (2022, May 29) First recorded Memorial Day observance took place in Hampton Park in 1865. Accessed May 21, 2026.
You may also be interested in:
Stay up-to-date with the latest content from NASA as we explore the universe and discover more about our home planet.
After marching from Selma, Martin Luther King Jr. stood on the steps of the state capitol in Montgomery, Alabama, and…
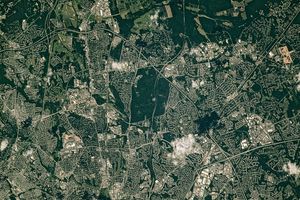
Along the northeast side of the Capital Beltway in Maryland, green spaces weave through the developed landscape.
A dusting of white highlighted the Colorado Plateau around the deep gorge, while shadows created a visual illusion.
The post An Early “Decoration Day” Celebration appeared first on NASA Science.
Tornado Draws a Jagged Line in Mississippi

A powerful supercell storm produced multiple tornadoes across southern Mississippi on May 6, 2026. The longest and most powerful spanned five counties, delivering wind speeds up to 137 miles (220 kilometers) per hour and EF-3 damage, as gauged by the Enhanced Fujita Scale, to several areas.
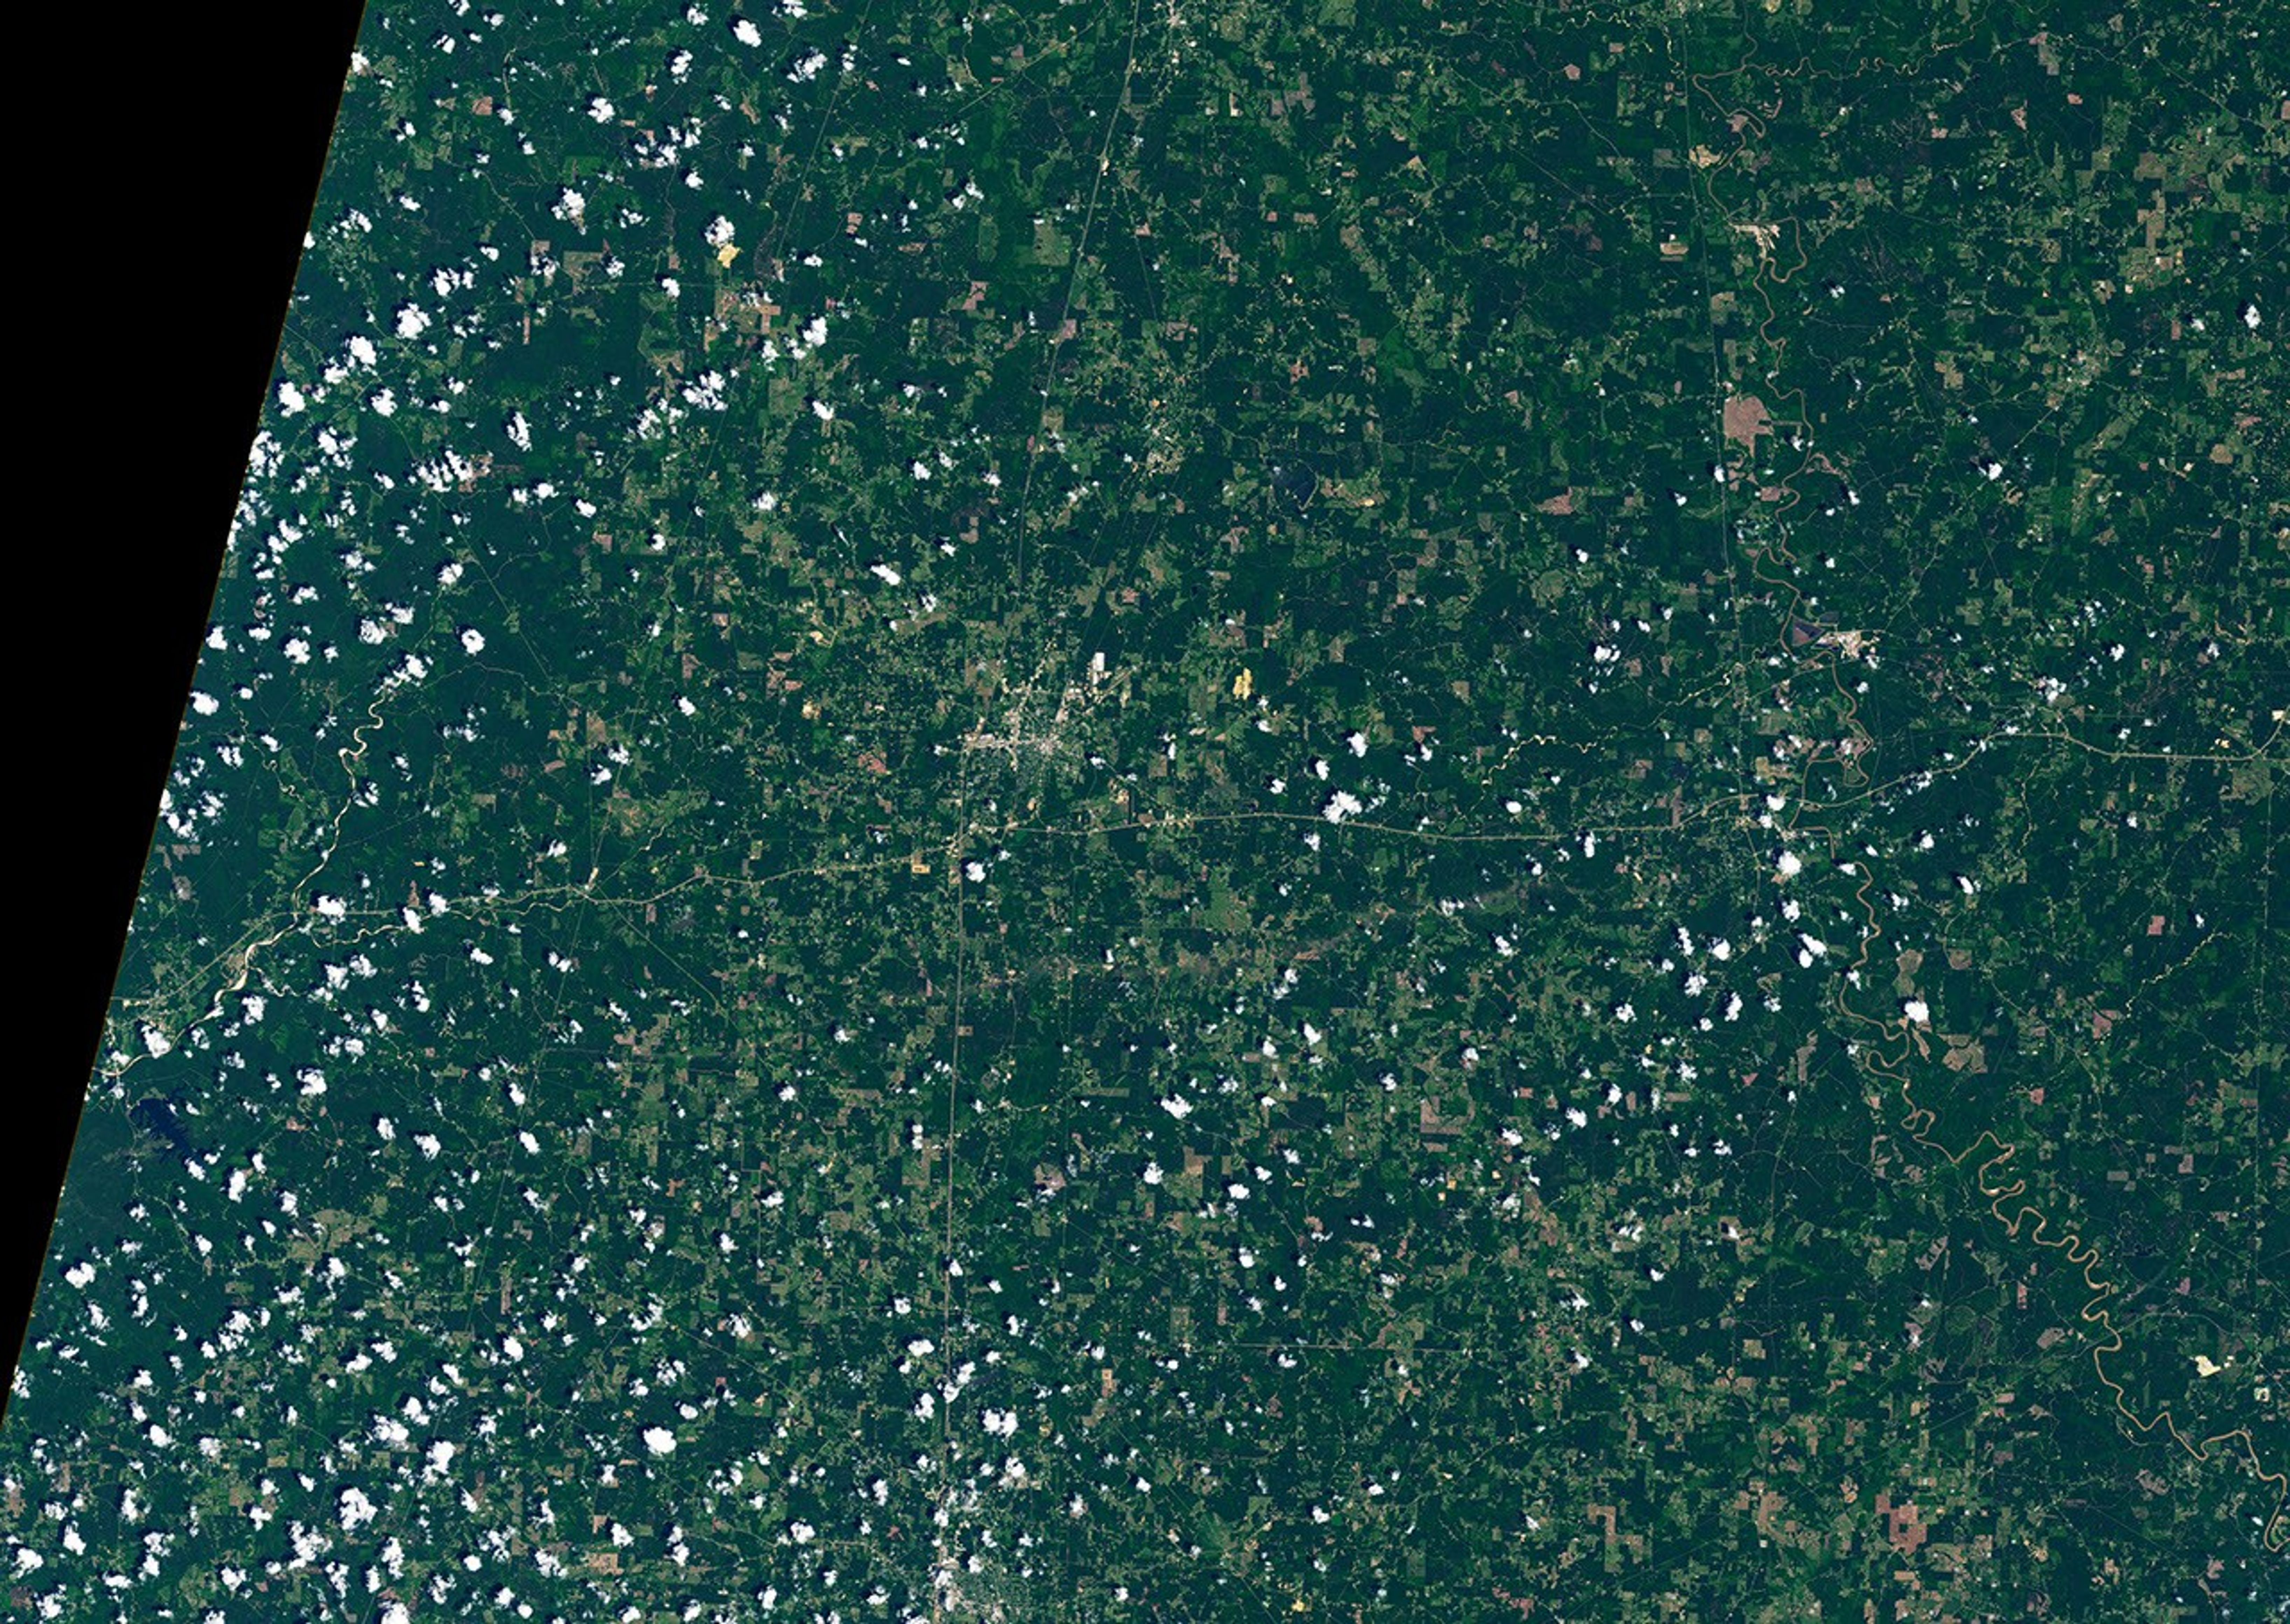
Part of this tornado’s destructive path was visible to the Landsat 8 satellite when it passed over the area on May 12. Winds snapped, uprooted, and tore bark and branches off trees, creating a brownish track across the landscape. This area, south of Brookhaven in Lincoln County, was one that sustained EF-3 damage. National Weather Service (NWS) post-event damage assessments noted extensive tree damage, a home whose exterior walls collapsed, and a mobile home park “devastated with debris.”
The tornado covered much more ground than is captured in this scene. It began in St. Catherine Creek National Wildlife Refuge near the Mississippi River, approximately 60 miles (100 kilometers) west-southwest of Brookhaven. In just over two hours, it traveled nearly 82 miles (132 kilometers), placing it among some of the longest tornadoes recorded in Mississippi. Heavy tree damage occurred along its entire path, NWS surveys found, with several instances of EF-2 structural damage and bent or collapsed transmission towers.
Seven tornadoes occurred in Mississippi on the evening of May 6, according to NWS preliminary data as of May 20. The Mississippi Emergency Management Agency received reports of damage to more than 400 homes and dozens of businesses and farm buildings statewide after the storms, according to a news release, the majority of which were in Lincoln County.
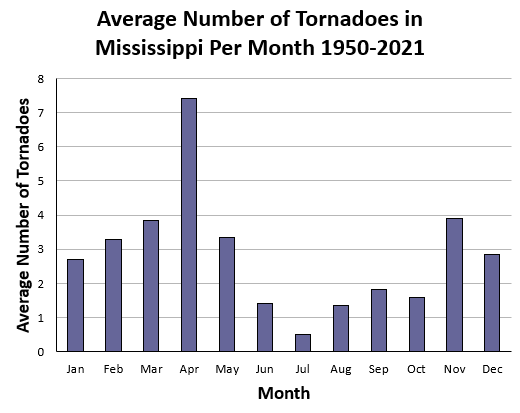
The Gulf Coast and other southeastern states are not considered part of what’s commonly known as Tornado Alley, an area encompassing much of the U.S. central and southern plains where supercells tend to form. However, this belt of southeastern states is also tornado-prone, experiencing a relatively high frequency of tornadoes in spring and late autumn. Historically in Mississippi, the most monthly tornadoes—an average of more than seven—occur in April, while May averages just over three. Some recent analyses have found decreases in tornado frequency in the Great Plains and increases in the Southeast over several decades.
NASA Earth Observatory images by Lauren Dauphin, using Landsat data from the U.S. Geological Survey. Story by Lindsey Doermann.
References & Resources
- AccuWeather (2026, May 7) EF3 tornado damages hundreds of homes, injures 17 in Mississippi. Accessed May 20, 2026.
- Kentucky Lantern (2025, May 19) Traditional ‘Tornado Alley’ shifts eastward as climate changes, says meteorologist studying trend. Accessed May 20, 2026.
- Mississippi Emergency Management Agency (2026, May 12) May 6-7, 2026, Severe Weather Update #5. Accessed May 20, 2026.
- NASA Applied Sciences (2025, March 24) Tracking Tornadoes from Space. Accessed May 20, 2026.
- National Centers for Environmental Information, Tornado Alley. Accessed May 20, 2026.
- National Weather Service (2026, May) 2026 NWS Jackson/Mississippi Tornado Information. Accessed May 20, 2026.
- National Weather Service, Severe Weather Statistics. Accessed May 20, 2026.
- NOAA (2026, May) Damage Assessment Toolkit. Accessed May 20, 2026.
You may also be interested in:
Stay up-to-date with the latest content from NASA as we explore the universe and discover more about our home planet.
Back-to-back subtropical cyclones in March fueled destructive flash flooding on several of the Hawaiian Islands.

An advancing cold front kicked up a sharp line of sand and other small particles that swept over the high…
In a precursor to Memorial Day, people in Charleston, South Carolina, honored fallen Civil War troops with flowers, songs, and…
The post Tornado Draws a Jagged Line in Mississippi appeared first on NASA Science.
New Eruption in the Bismarck Sea


It’s a truism among oceanographers that there is more accurate mapping of the surface of the Moon and Mars than of the deep-ocean floor. That’s especially true for the Bismarck Sea, a relatively deep body of water north of Papua New Guinea. It’s an ocean basin with a geologically complex seafloor rife with faults, volcanic features, rifts, scarps, and active subduction and spreading zones at depths that make high-resolution sonar mapping challenging.
When satellites detected signs of an unexpected submarine volcanic eruption in the Central Bismarck Sea on May 8, 2026, volcanologists were confronted with the reality that no high-resolution maps of the area were available, and relatively little is known about the deep-water eruption setting. The new eruption is thought to be occurring along the Titan Ridge, about 16 kilometers (10 miles) southeast of the location of a submarine eruption in 1972. However, there is little clarity or consensus among scientists about precisely which volcanic feature may be erupting, the original depth of the currently active vent, or when it last erupted.
“The good news is that there are huge opportunities to explore and learn using both government and commercial satellite platforms already in orbit,” said Jim Garvin, the chief scientist at NASA’s Goddard Space Flight Center.
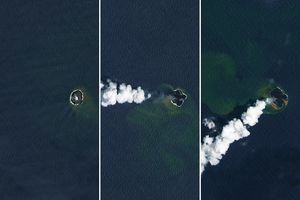
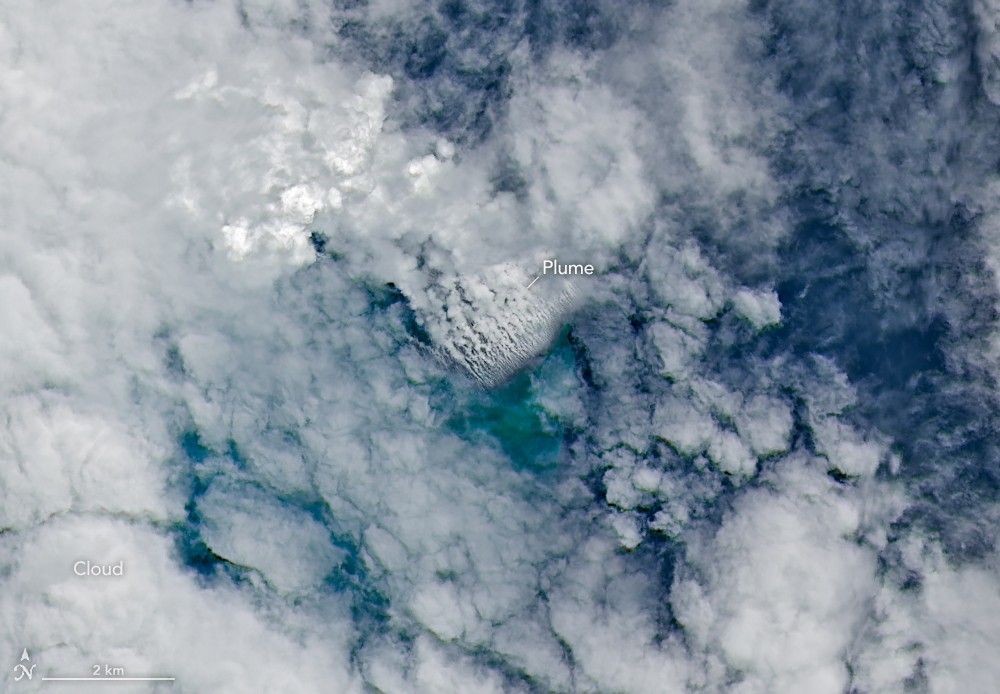
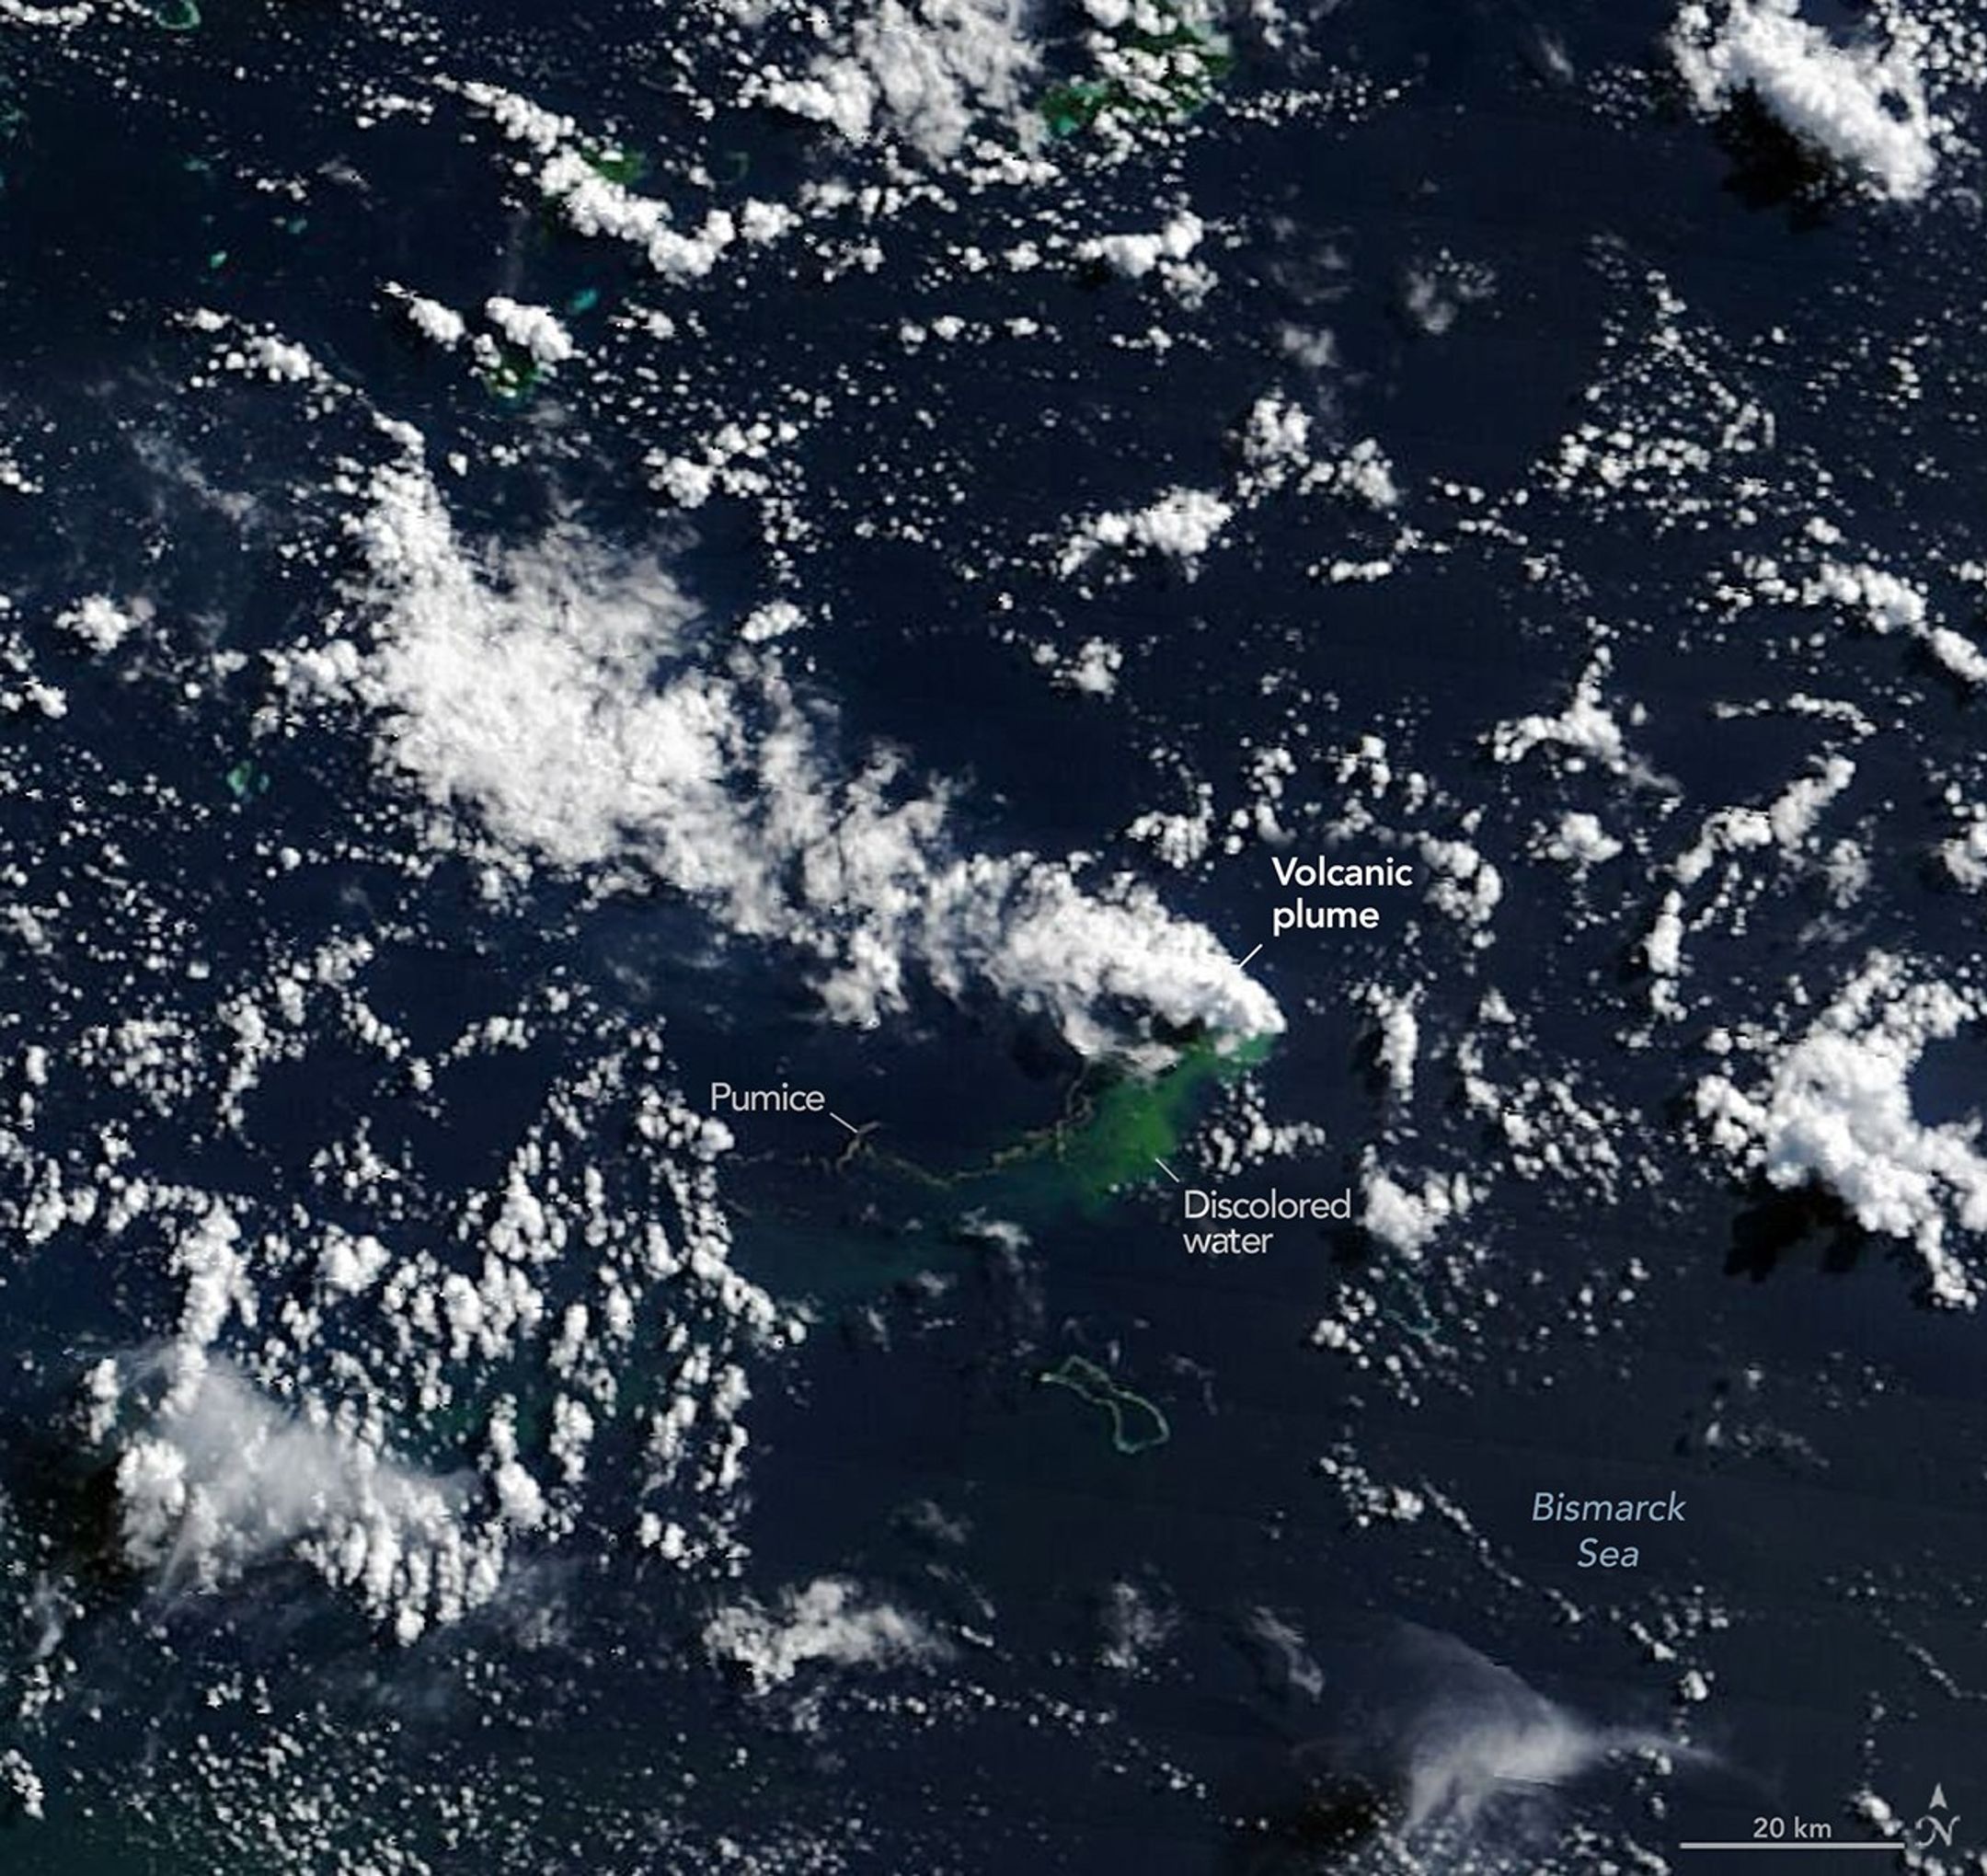
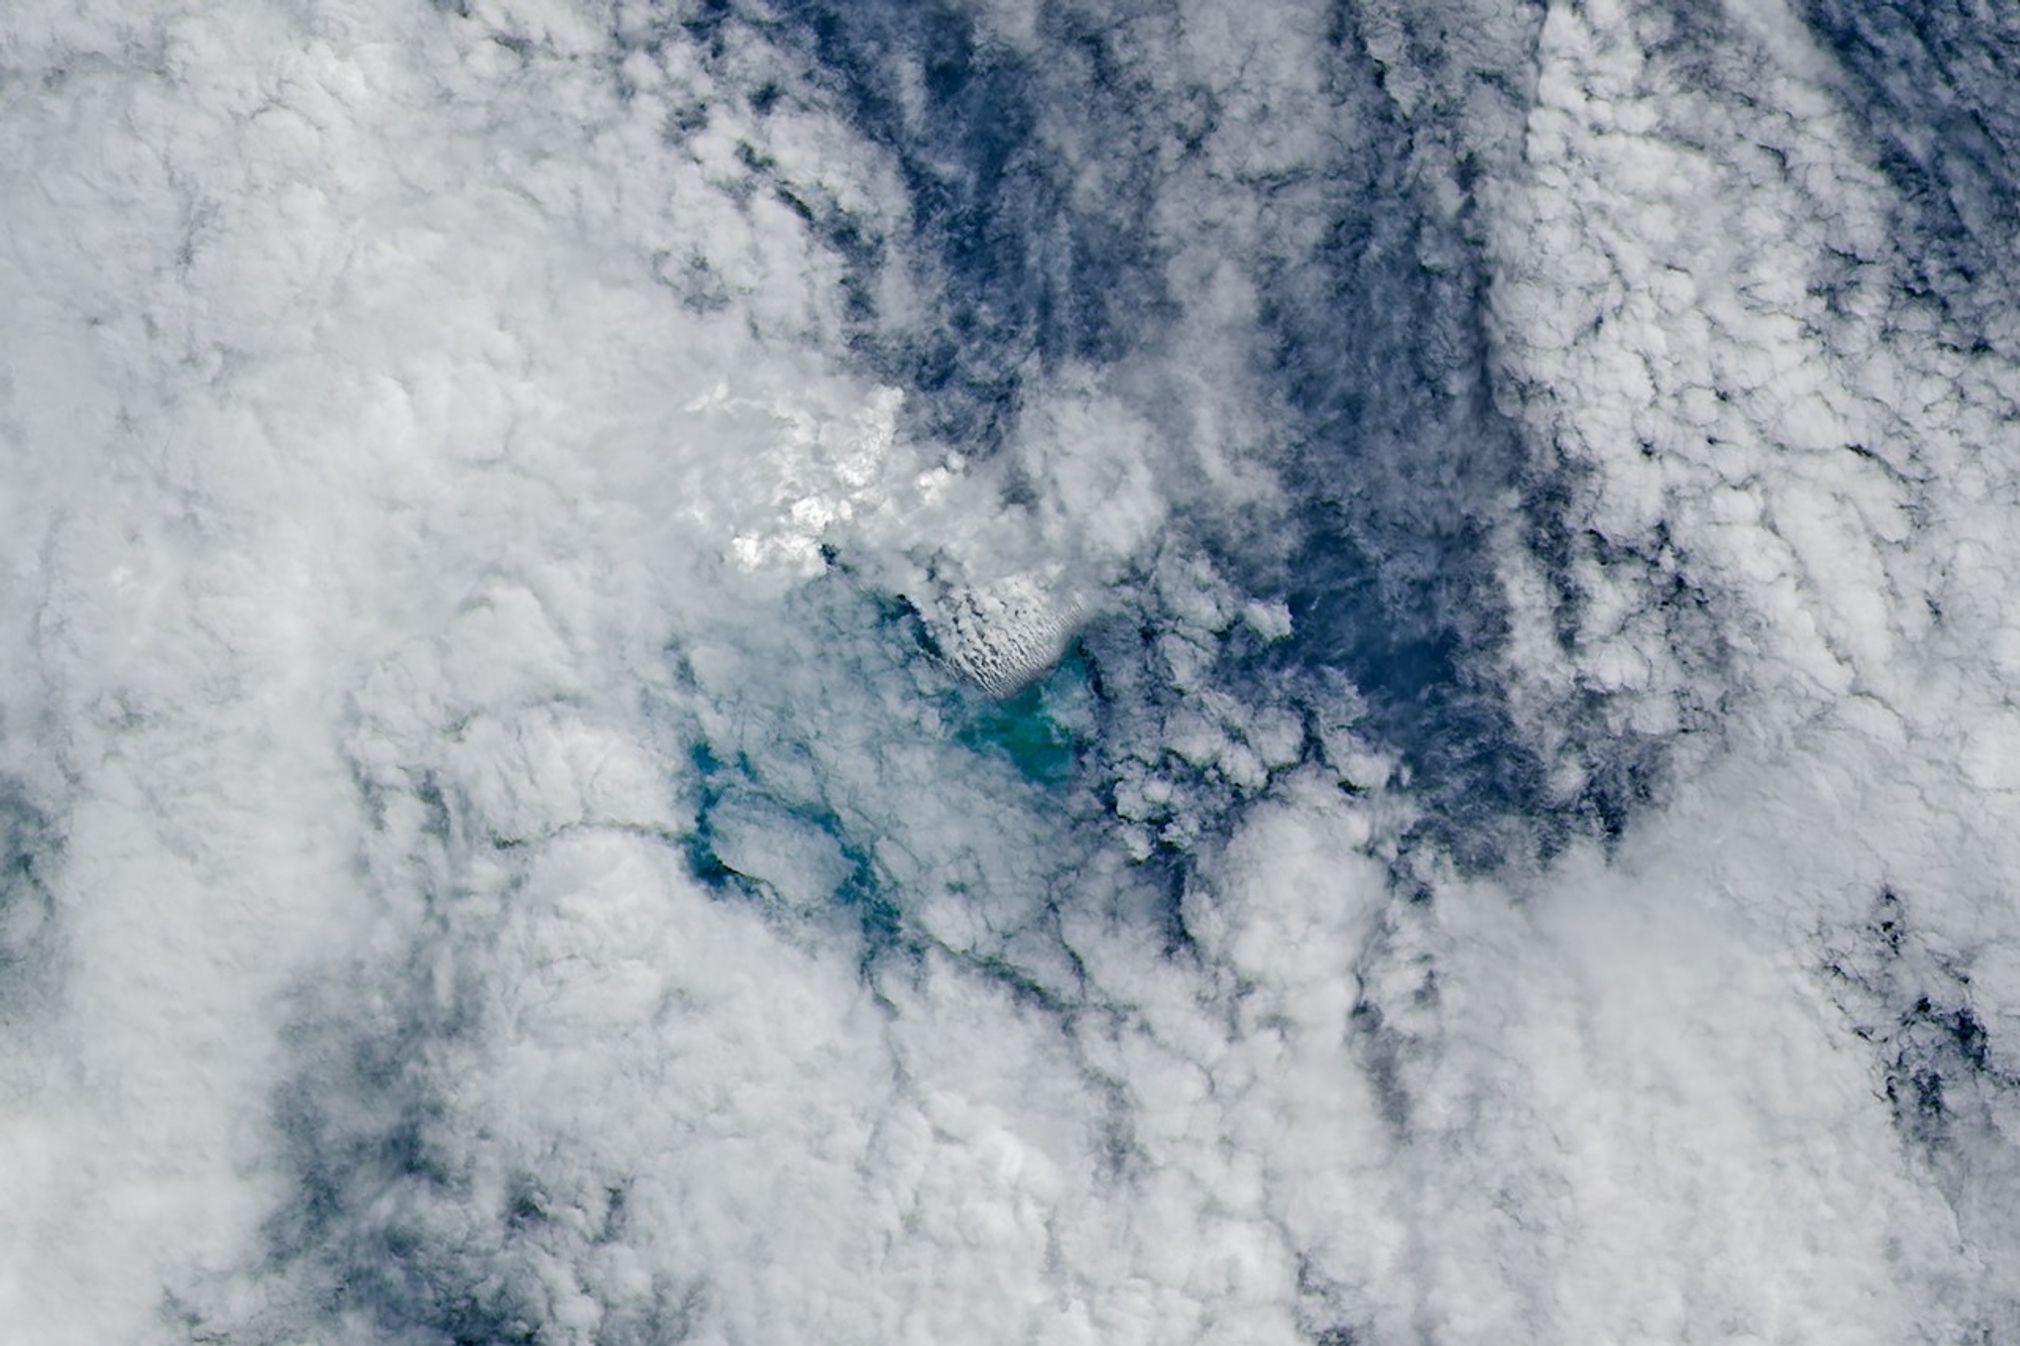
What is known is that seismometers detected a small swarm of earthquakes on May 8, followed soon after by clear signs of a submarine eruption in satellite observations. Beginning on May 9, NASA’s Aqua and Terra satellites captured optical imagery of white, steam-rich volcanic plumes rising into the atmosphere, while the ocean color sensor on NASA’s PACE (Plankton, Aerosol, Cloud, Ocean Ecosystem) satellite revealed discolored and disturbed water surrounding the eruption site.
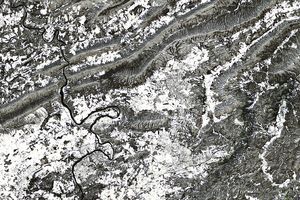
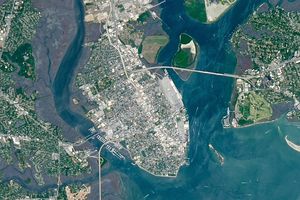
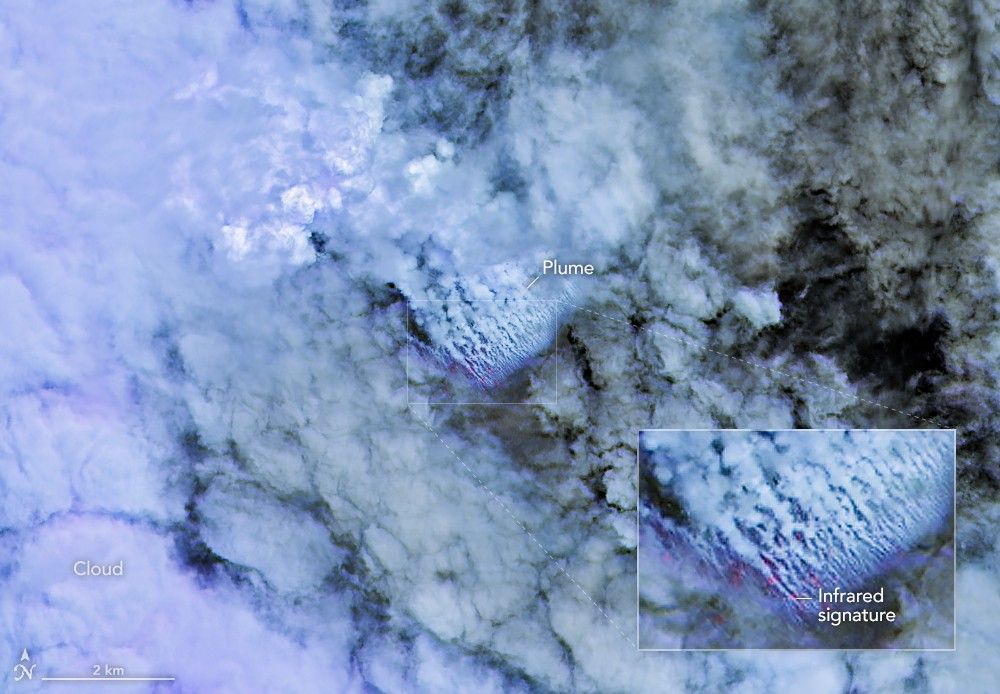
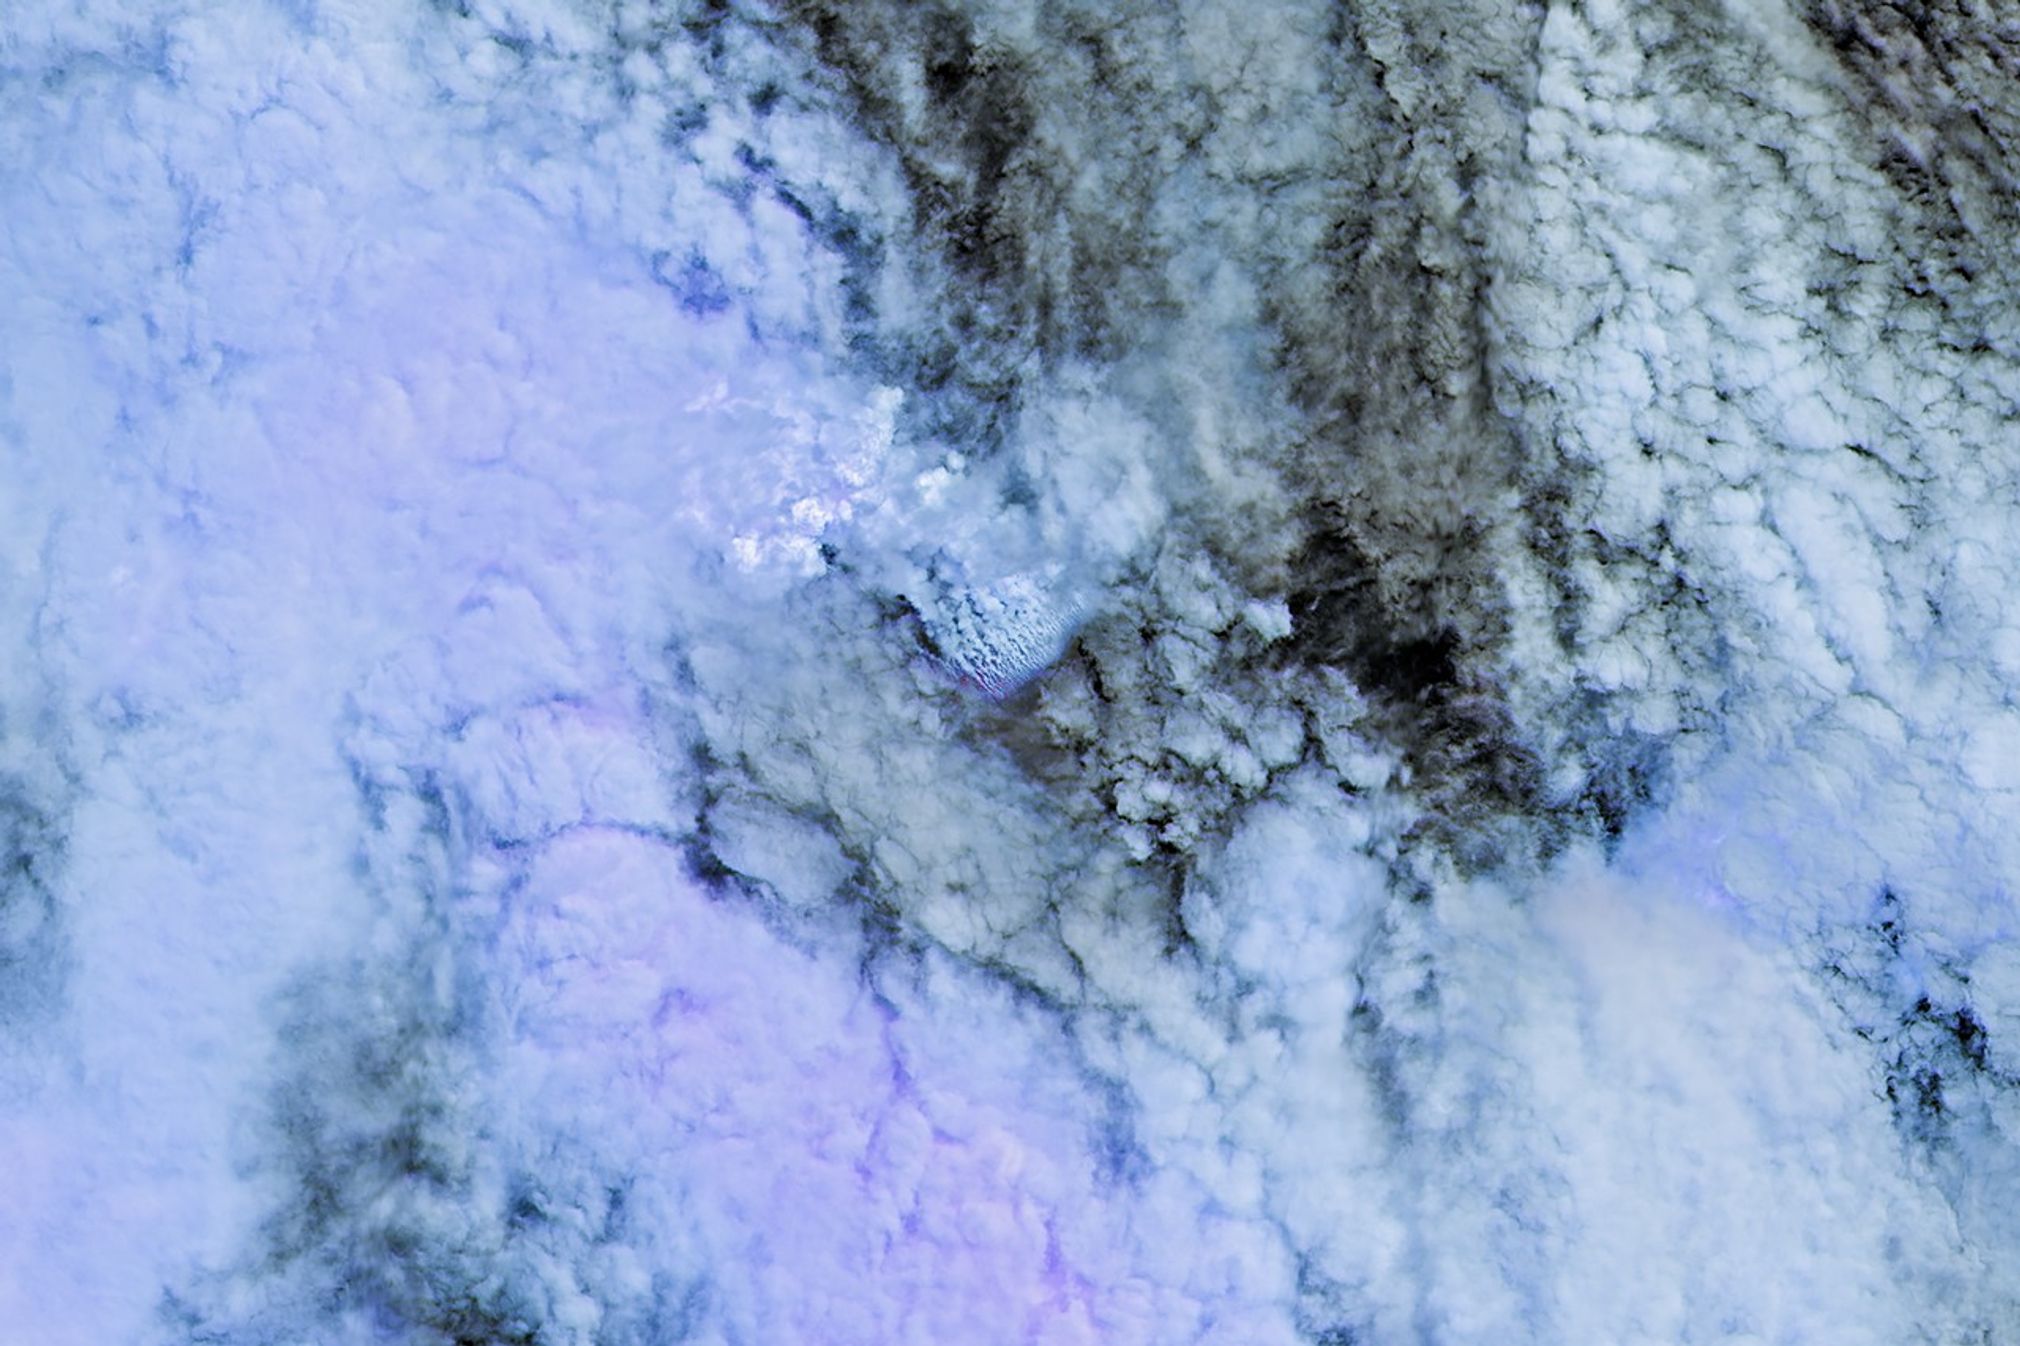
Other satellites observed ash plumes soaring several kilometers into the atmosphere. Higher resolution imagery from the European Space Agency’s Sentinel-2 and the NASA/USGS Landsat 9 (top) satellites, acquired on May 10 and 11, respectively, captured detailed views of activity near the water surface. The right image at the top of the page shows the same scene in false color (bands 7-6-5), with the inset highlighting the infrared signature of the eruption. On May 12, the VIIRS (Visible Infrared Imaging Radiometer Suite) on Suomi NPP detected thermal anomalies spanning roughly seven square kilometers.
“There must be a lot of hot material near the surface to generate so many thermal anomalies,” said Simon Carn, a volcanologist at Michigan Tech. “This suggests a fairly shallow eruption vent—much shallower than what’s implied by the existing bathymetry, which shows water depths of several hundred meters or more.”
Optical satellite imagery shows intense activity in near-surface water, including large plumes of discolored water and widely distributed steam and ash vents. Both medium– and high-resolution sensors—from both government sources and commercial satellite companies—have captured images of expansive pumice rafts (floating volcanic rocks) forming long bands in the surface currents in recent days.
“We’re now eagerly waiting to see if a new island is about to be born—something that we’ve only rarely been able to observe with satellites as it happens,” Garvin said. If a new island does emerge, volcanologists will be watching it closely to see how it evolves. It could build a tuff cone with a long-lived vent crater, or it could collapse and erode rapidly. The eruption could also take a much more explosive turn if seawater finds its way into the shallow magma chamber that has risen within the growing underwater structure.
To date, the eruption has been much less explosive than other recent submarine eruptions, such as those at Hunga Tonga-Hunga Ha’apai in 2022 and Fukutoku-Okanobain 2021. It seems unlikely that this event will become highly explosive because it appears to be associated with a volcanic ridge near the junction of a transform fault and a back-arc spreading center, Carn said. “Spreading centers are associated with less explosive activity, while the most explosive eruptions are usually along subduction zones and involve large stratovolcanoes.”
How long the current eruption will persist is unclear. The 1972 event in this general region lasted for just four days, while another submarine eruption that occurred about 100 kilometers away in the St. Andrew Strait in 1957 lasted nearly four years.
Garvin and scientists from other institutions are tracking developments closely. He plans to analyze radar data from the NASA-ISRO NISAR satellite and the Canadian Space Agency’s RADARSAT Constellation Mission to map the contours of any new land that emerges and track how its shape changes over time. If a permanent island forms, Garvin also sees opportunities for researchers, or “island-nauts,” to visit the area and study how the infant island responds to plant and animal colonization, rainfall, chemical weathering, and other erosive forces, just as happened after the Hunga Tonga-Hunga Ha‘apai eruption.
“This new eruption could present an even better opportunity for ‘island-naut’ exploration as we prepare to return to the Moon with women and men via Artemis IV,” he said.
NASA Earth Observatory images by Michala Garrison, using Landsat data from the U.S. Geological Survey and MODIS data from NASA EOSDIS LANCE and GIBS/Worldview. Story by Adam Voiland.
References & Resources
- ABC (2026, May 19) Undersea volcano erupts in Papua New Guinea’s Bismarck Sea prompting tsunami concerns. Accessed May 20, 2026.
- Bureau of Meteorology (2026) Darwin Volcanic Ash Advisories. Accessed May 20, 2026.
- Carn, S., via Bluesky (2026, May 12) New submarine #volcanic #eruption in the Central Bismarck Sea. Accessed May 20, 2026.
- Global Volcanism Program (2026, May 13) Central Bismarck Sea. Accessed May 20, 2026.
- Ikegami, F., via Bluesky (2026, May 19) Another magnificent photo has been dropped. Accessed May 20, 2026.
- NASA (2026) Volcanoes. Accessed May 20, 2026.
- PNG Bulletin (2026, May 20) Submarine Volcano Eruption in Bismarck Sea Under Close Monitoring. Accessed May 20, 2026.
- RNZ (2026, May 20) Could the rare submarine volcano erupting in PNG blow big? Accessed May 20, 2026.
You may also be interested in:
Stay up-to-date with the latest content from NASA as we explore the universe and discover more about our home planet.
The Tongan volcano expanded its mid-Pacific real estate during its latest eruptive phase.

Episode 43 of the Hawaiian volcano’s current eruption was marked by high lava fountains and widespread ash dispersal.

The volcano on Indonesia’s Halmahera Island routinely ejects ash, volcanic gases, and volcanic bombs.
The post New Eruption in the Bismarck Sea appeared first on NASA Science.
Fire Chars Santa Rosa Island

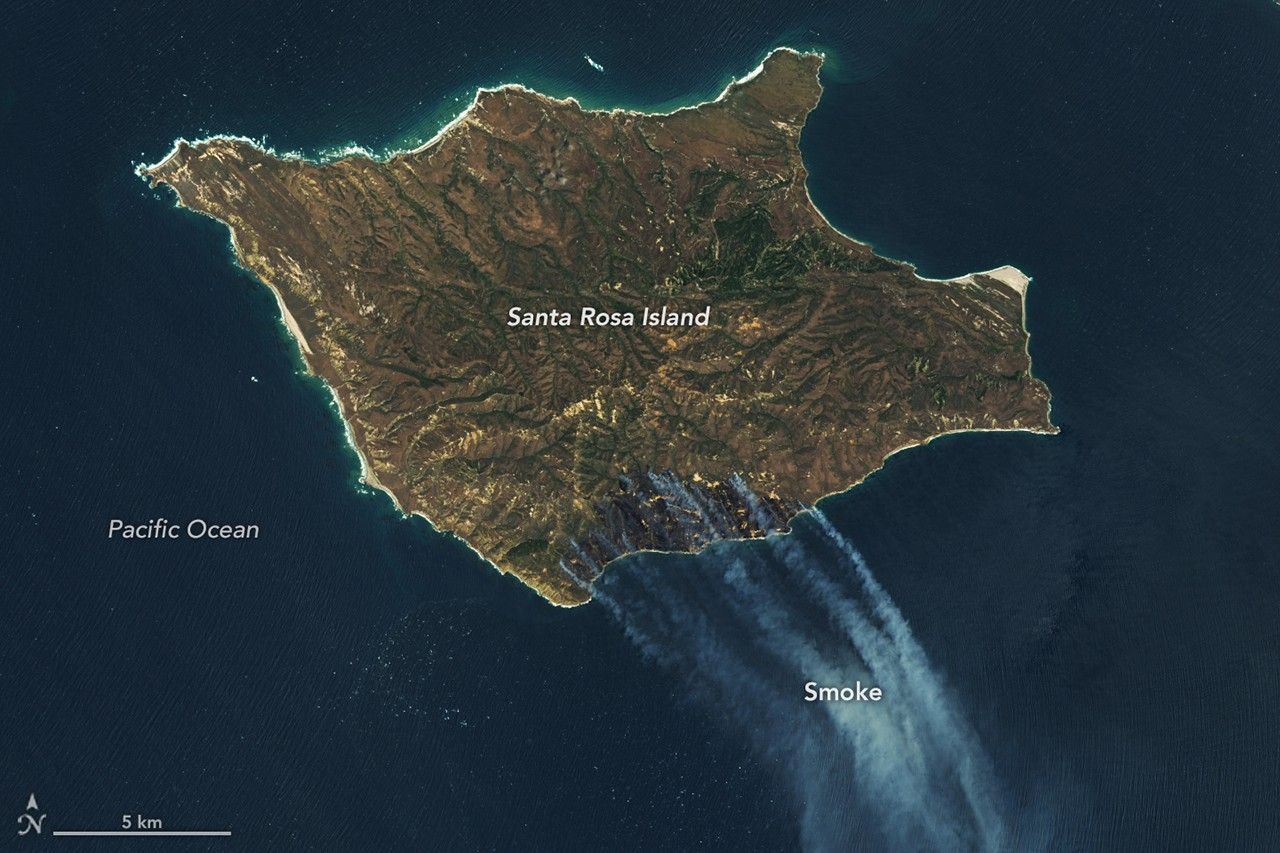
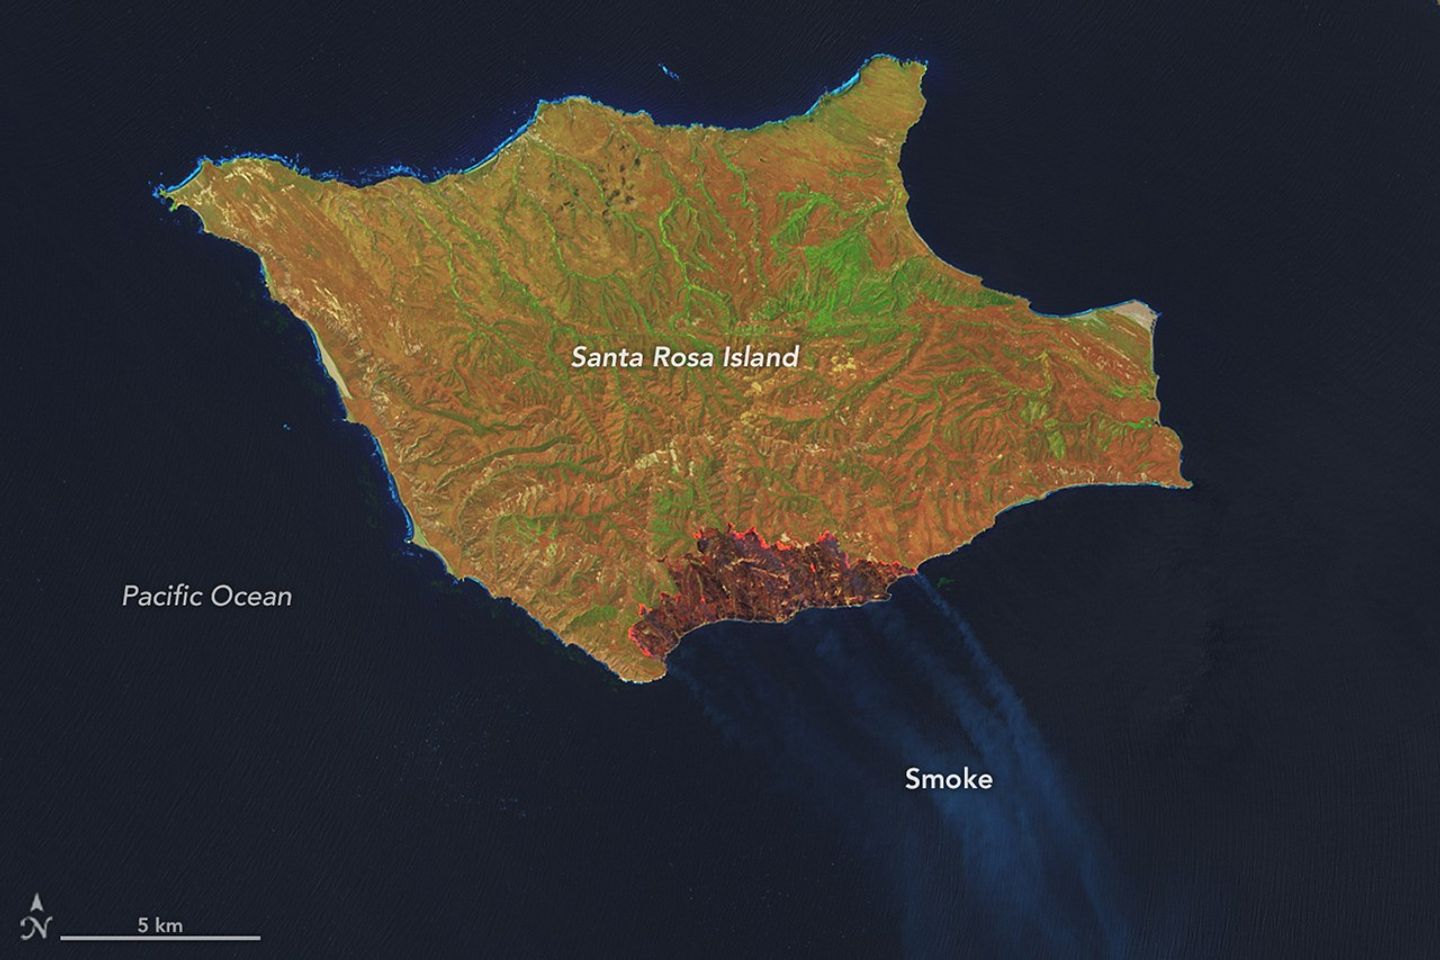

Channel Islands National Park, a chain of five ecologically rich islands off the coast of mainland California, is known for its diversity of plant and animal species, earning it the nickname “North America’s Galapagos.” For part of May 2026, Santa Rosa Island—the park’s second-largest island—was closed to the public as firefighters worked to contain a wildland fire burning through grassland, coastal sage scrub, and areas of island chaparral.
The fire was first spotted from aircraft on May 15, 2026, and confirmed by the National Park Service that morning. The Landsat 9 satellite captured these images the next day, when the burned area had grown to 5,690 acres (2,300 hectares). By May 19, it had burned around 16,600 acres (6,700 hectares), including much of the southeastern quadrant of the island. Its perimeter remained uncontained.
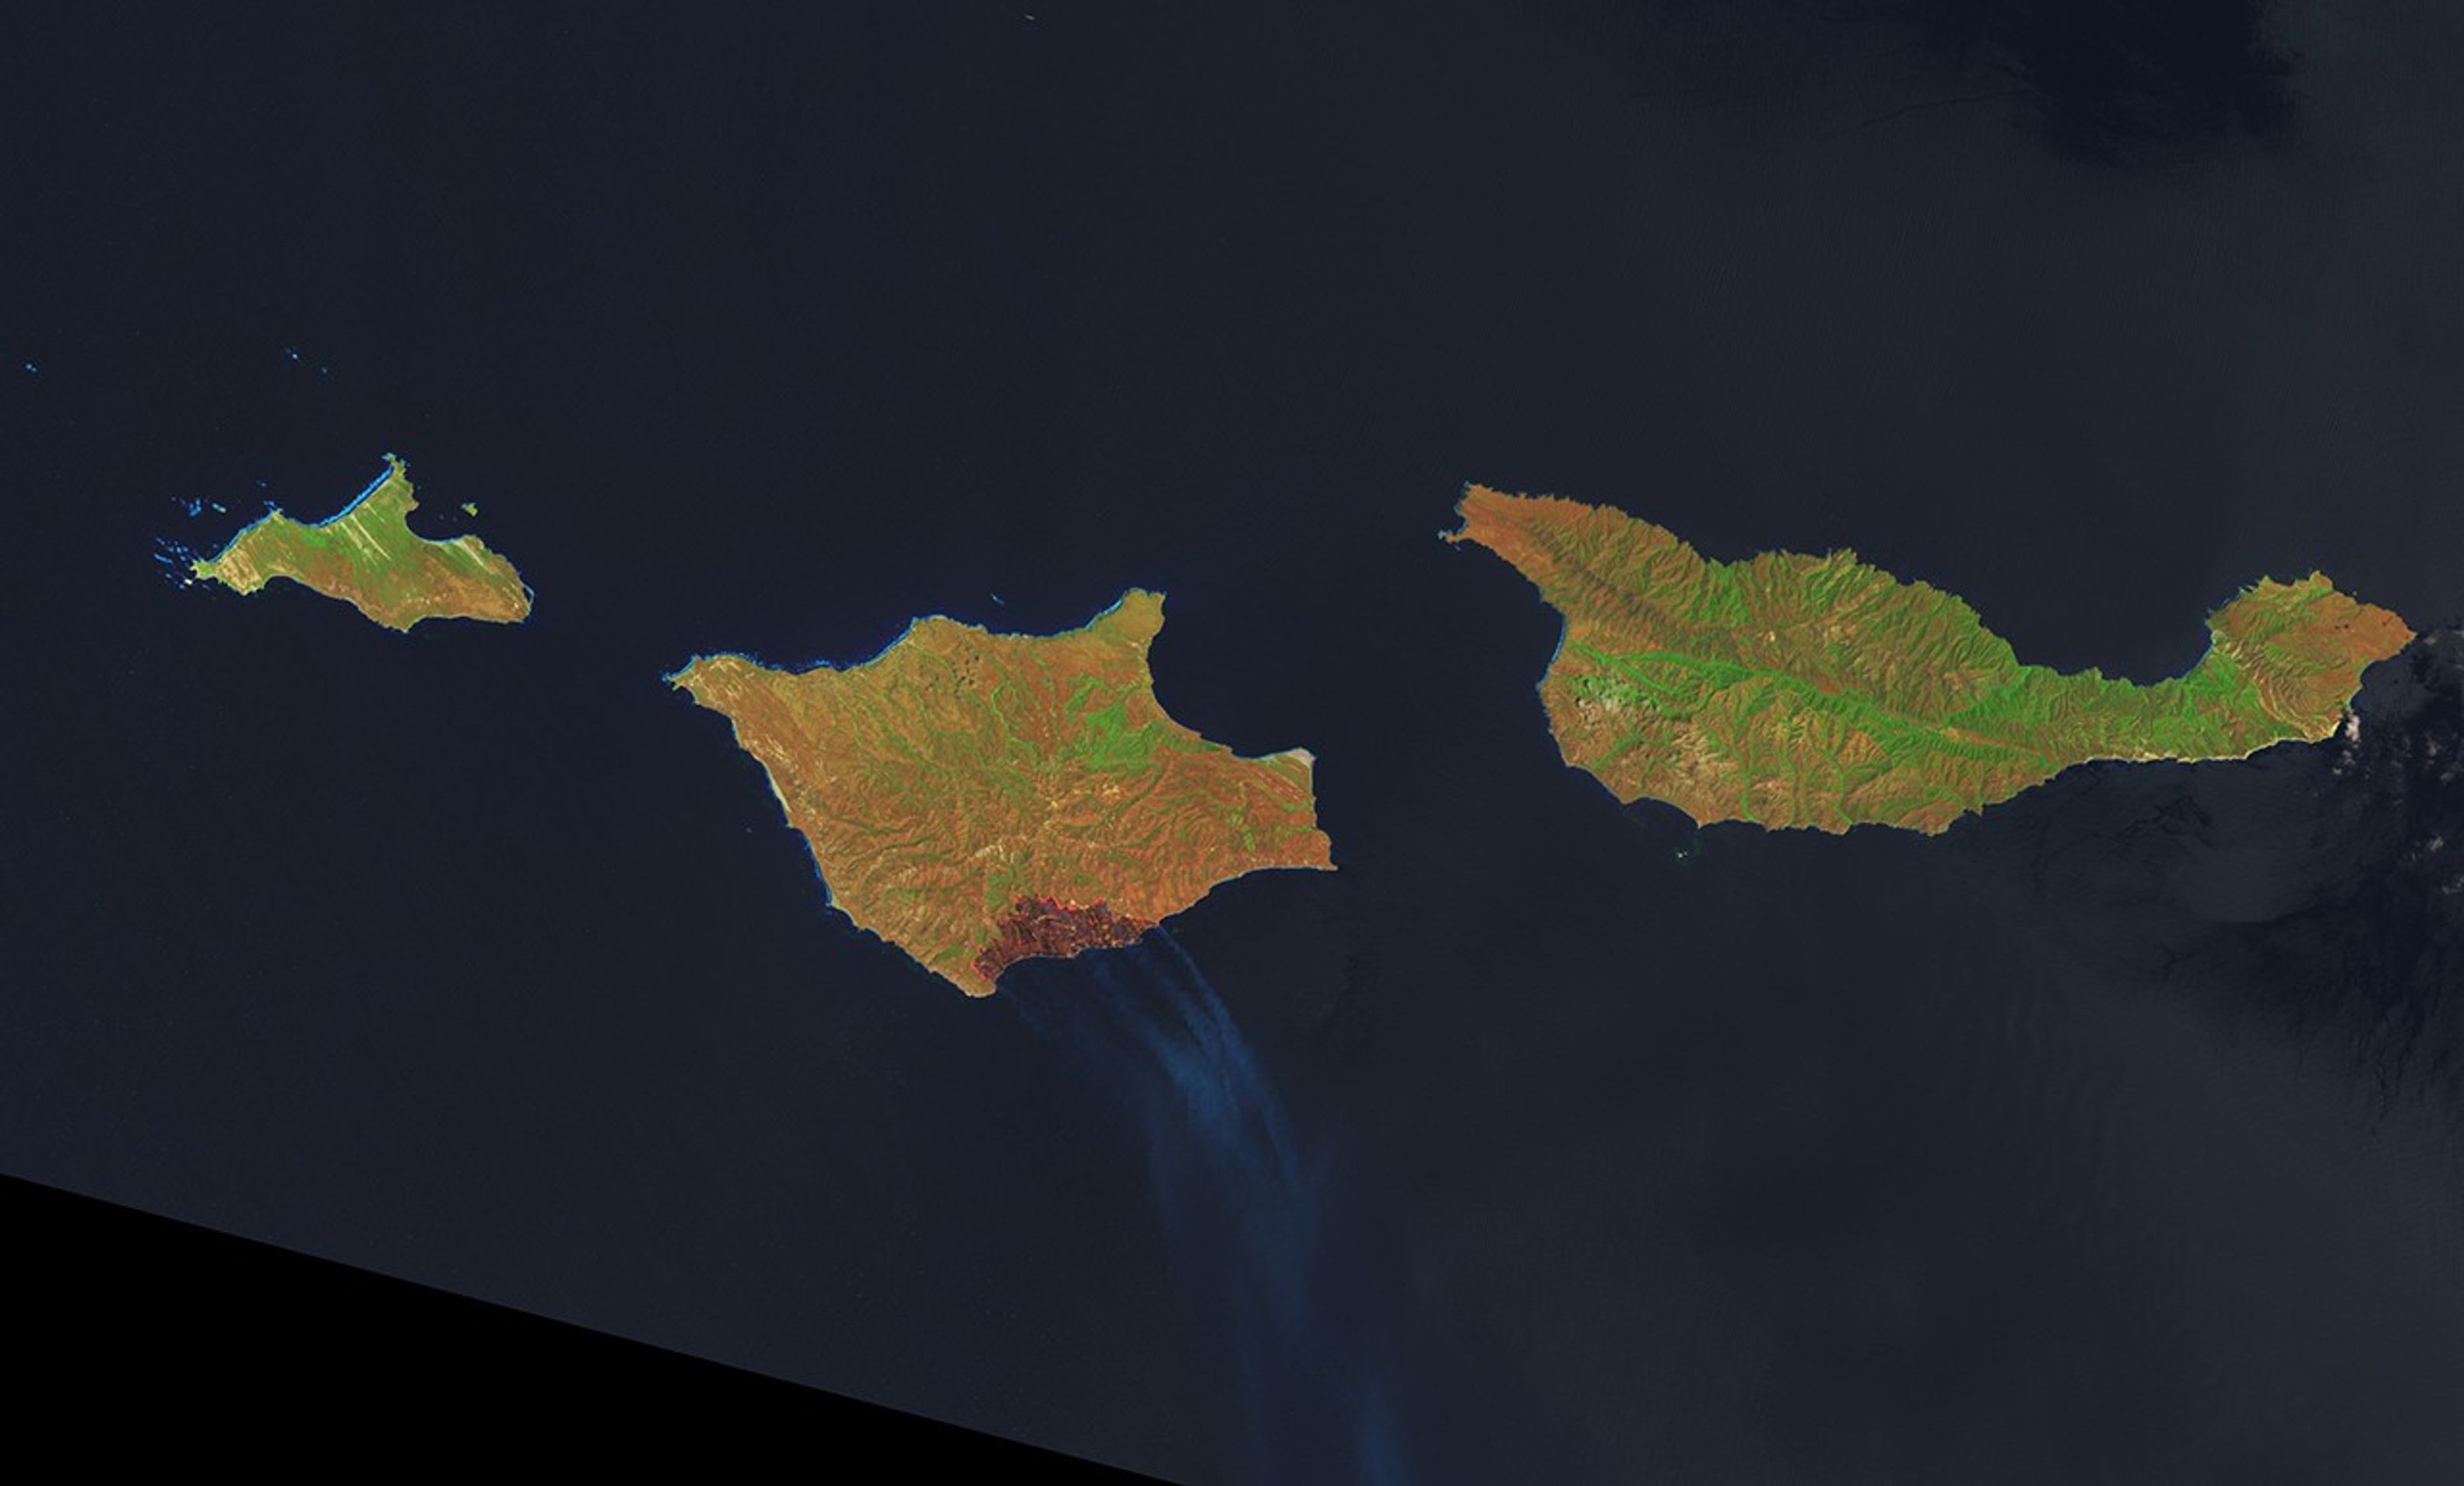
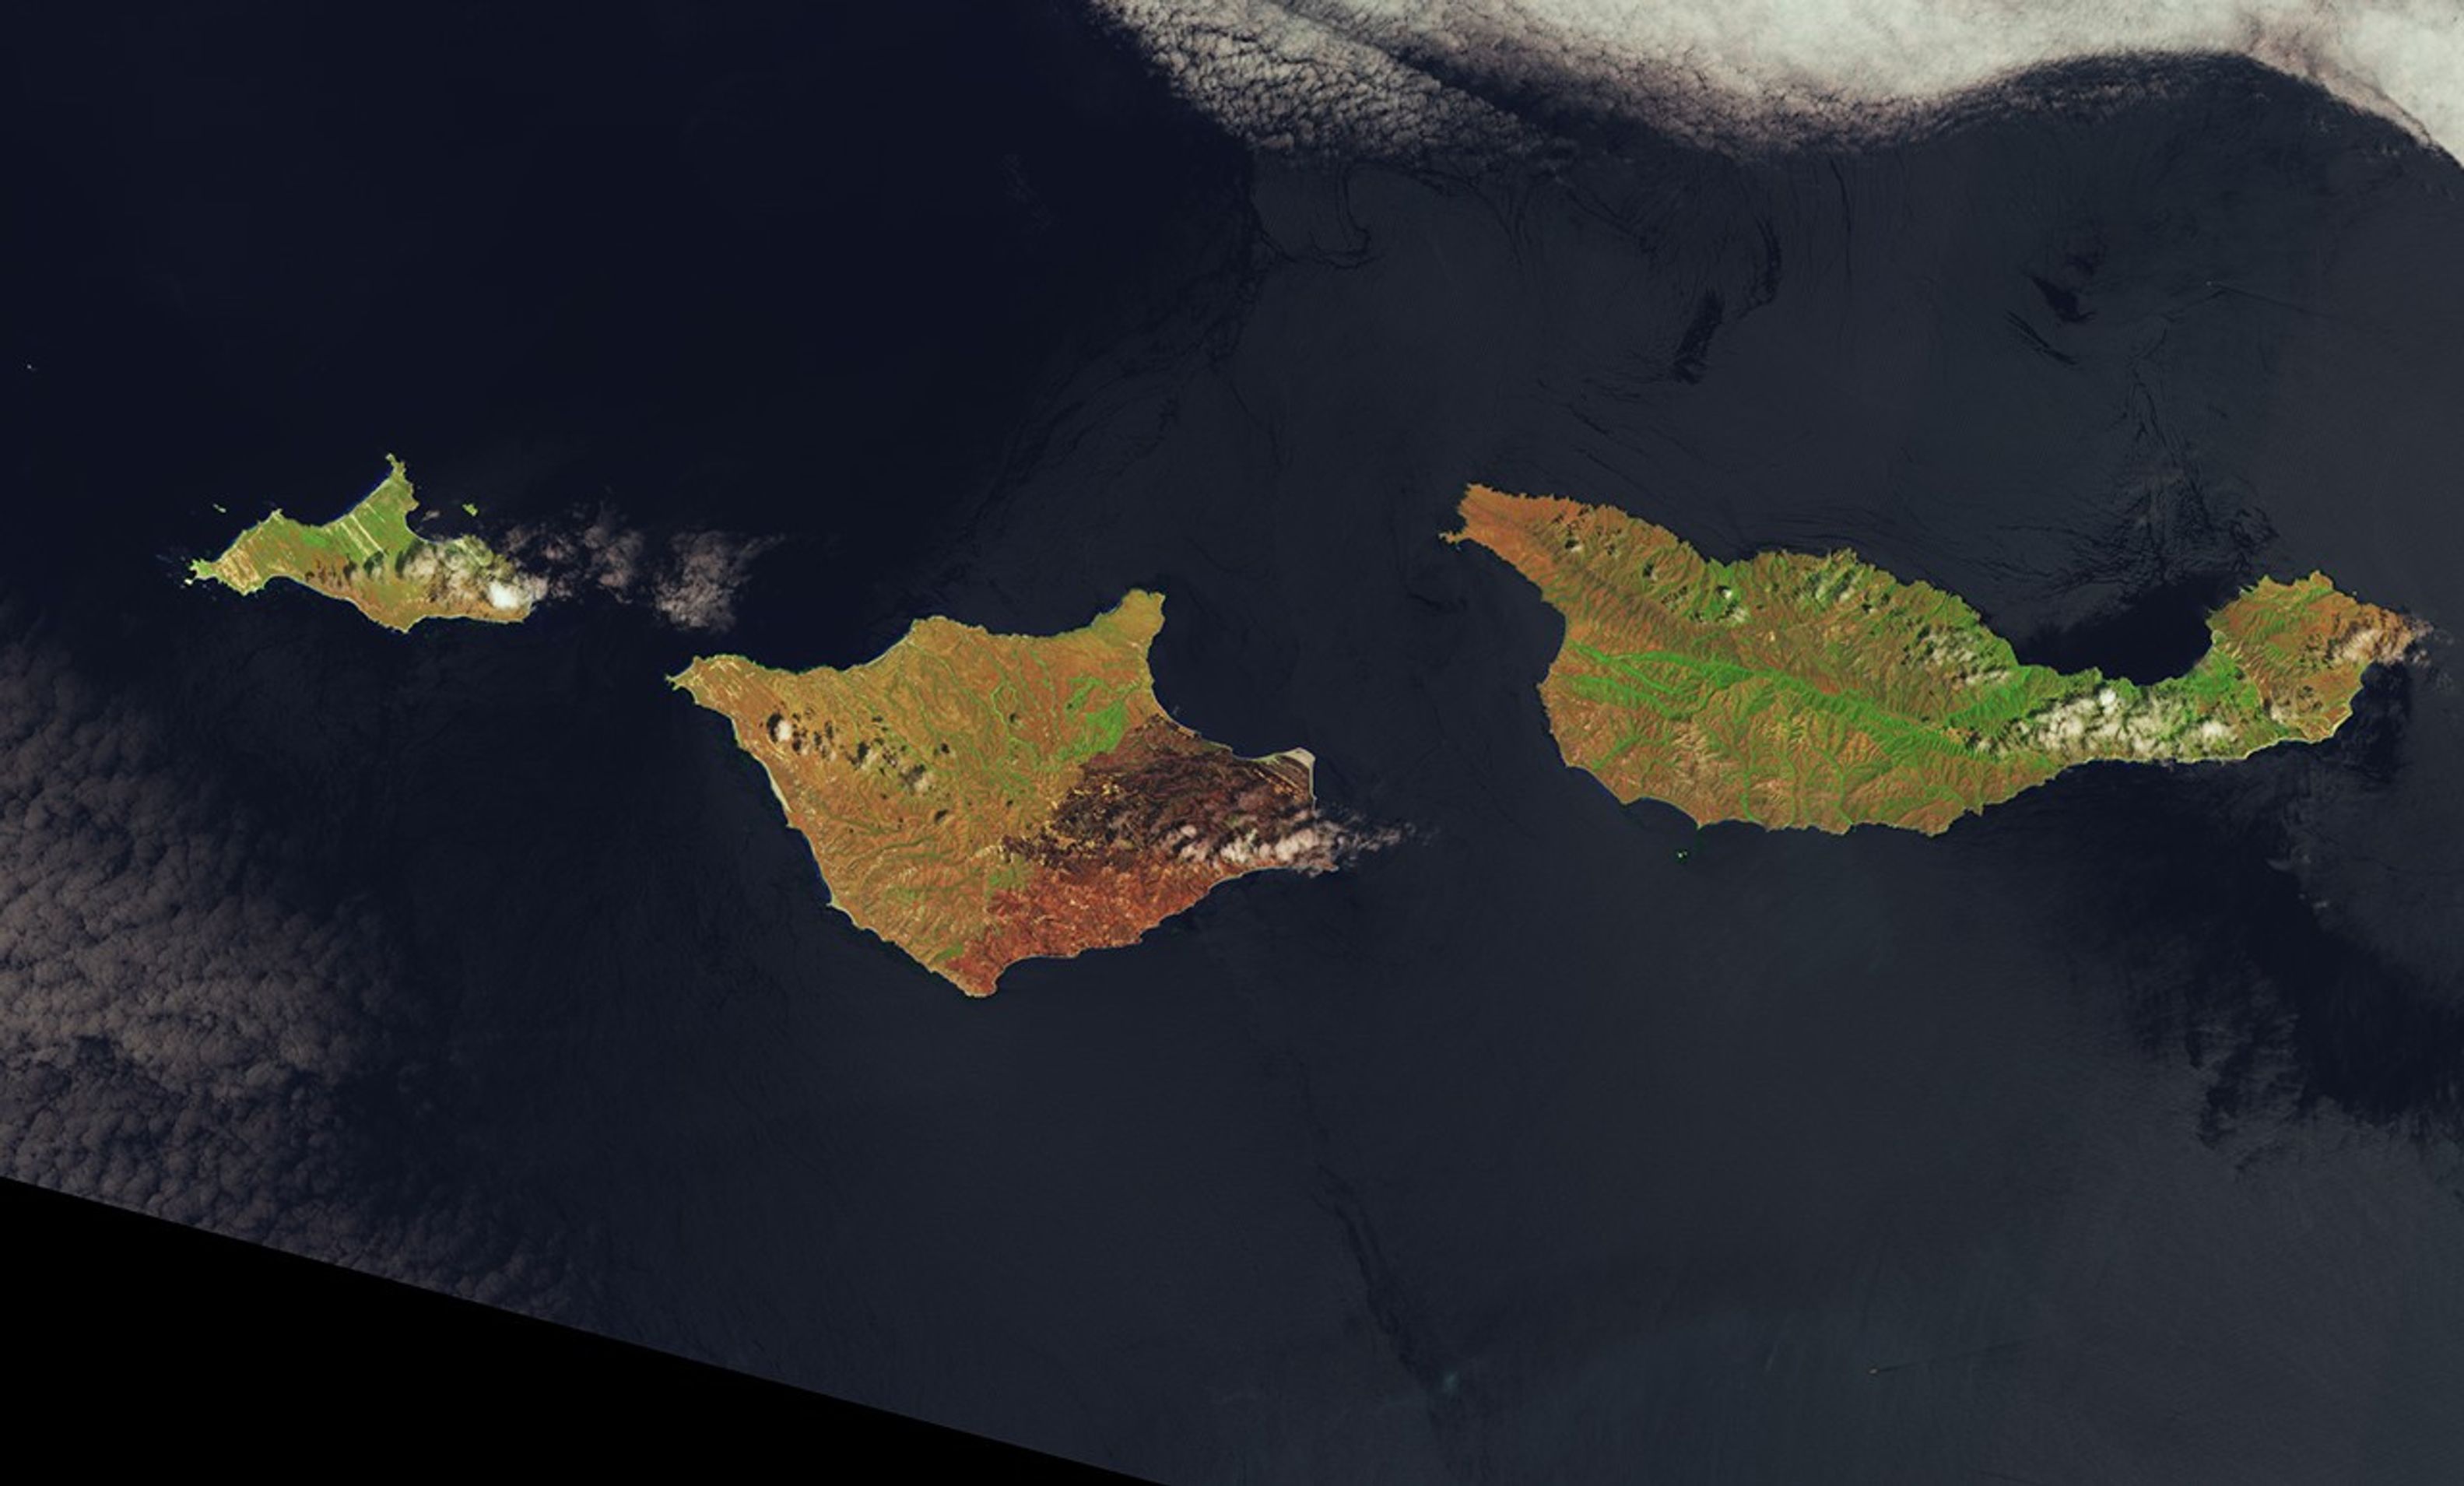
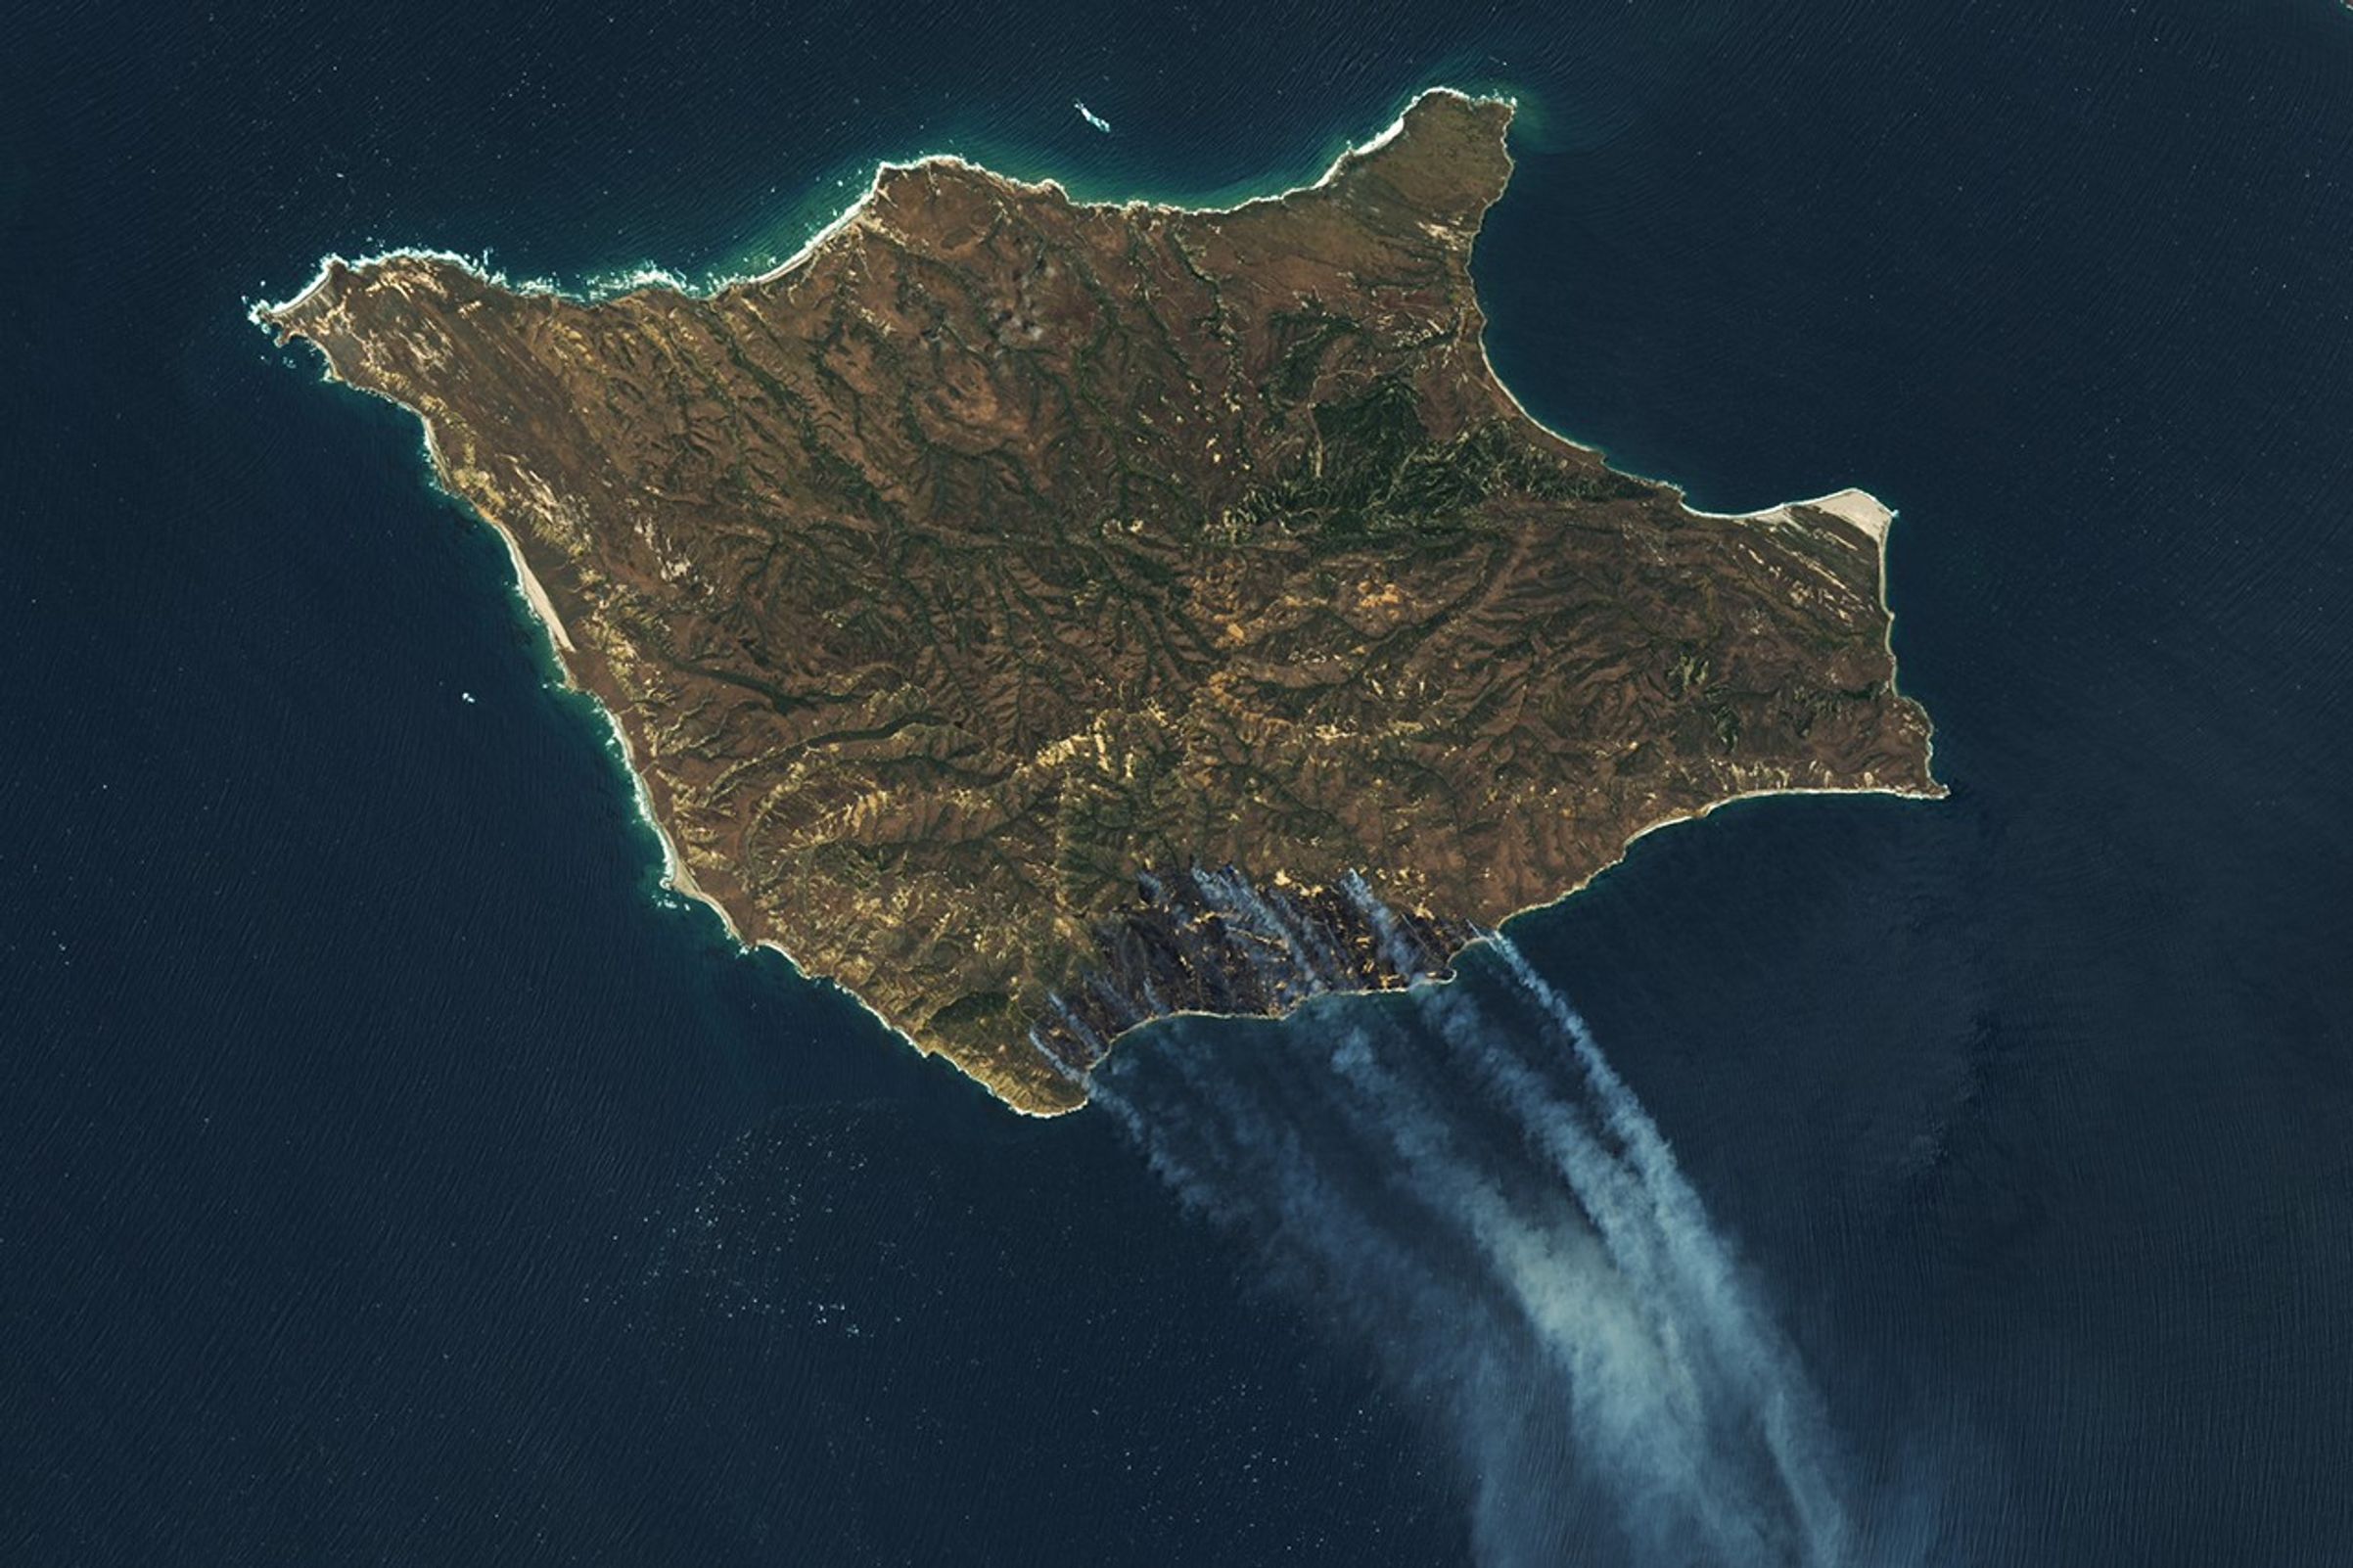
The left image is false color, composed of wavelengths that cut through the smoke to reveal the burned area (dark brown). The infrared signature of the actively burning fire front is orange. The second image, on the right, shows the same area in natural color, as human eyes would see it, with smoke pouring over the Pacific Ocean.
Officials and news accounts said the fire was human-caused, though investigators were still working to determine the circumstances surrounding the event. According to news reports, the fire burned near a stand of Torrey pines, a rare type of pine that in the United States grows naturally only on Santa Rosa Island and near San Diego.
NASA Earth Observatory images by Lauren Dauphin, using Landsat data from the U.S. Geological Survey. Story by Kathryn Hansen.

References & Resources
- InciWeb (2026, May 19) Santa Rosa Island Fire. Accessed May 19, 2026.
- NASA Earth Observatory (2025, April 21) North America’s “Galapagos.” Accessed May 19, 2026.
- National Park Service, Channel Islands. Accessed May 19, 2026.
- The New York Times (2026, May 18) A Sailor Shot Distress Flares. Now a California Island Is Burning. Accessed May 19, 2026.
You may also be interested in:
Stay up-to-date with the latest content from NASA as we explore the universe and discover more about our home planet.
A wildland fire charred grassland, coastal sage scrub, and chaparral across one-third of the island, the second largest of the…
The National fire has burned tens of thousands of acres within the Florida preserve, fueled by vegetation dried by prolonged…
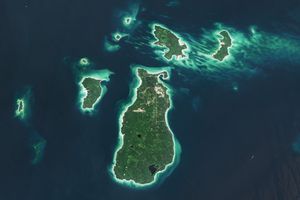
Beaver Island is one in a string of verdant and scenic jewels in a northern Lake Michigan archipelago.
The post Fire Chars Santa Rosa Island appeared first on NASA Science.